

Languages of Innovation
Not equal, unsurprisingly


In the report The Demographics of Innovation in the United States (2016), the authors, Nager et al., examined the characteristics of innovators in the United States using R&D awards and triadic patents for large tech companies, life sciences, information technology, and material sciences as measures of innovation. Unfortunately, the report doesn’t provide the rate of representation in innovation by country, only broadly by region (see Table 8). However, Appendix E, Table 37 of that report lists the share of U.S. innovators by language family:
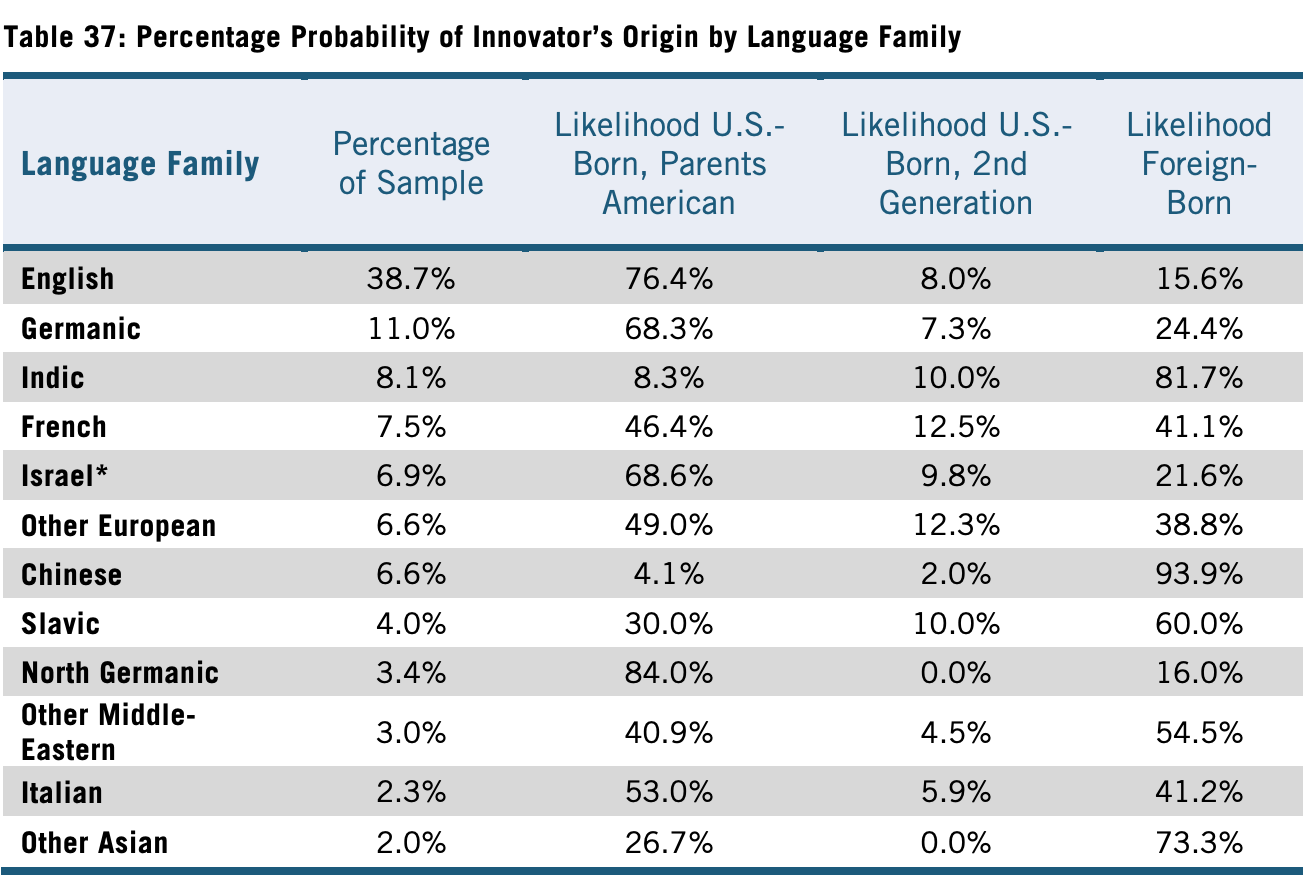
I was able to copy the author’s methodology for calculating the rate of representation for innovation with regards to the language families listed. It’s fairly simple:
Take the percentage of innovators from a given language family (from Table 37).
Multiply it by the percentage of innovators in that language family who are foreign-born.
Divide the result by the share of that language family’s U.S. population who were foreign-born in 2015 using data from the American Community Survey.
This gives a measure of how strongly each language family is represented in innovation relative to their immigrant population size. I skipped language families with heavy international overlap (like English or French), since ACS data would blur the contributors. Though, it’s probably fair to assume that migrants from the ethnically Anglo or French countries and territories would perform well. So, lo and behold, here are the results (rounded to the nearest second decimal place):
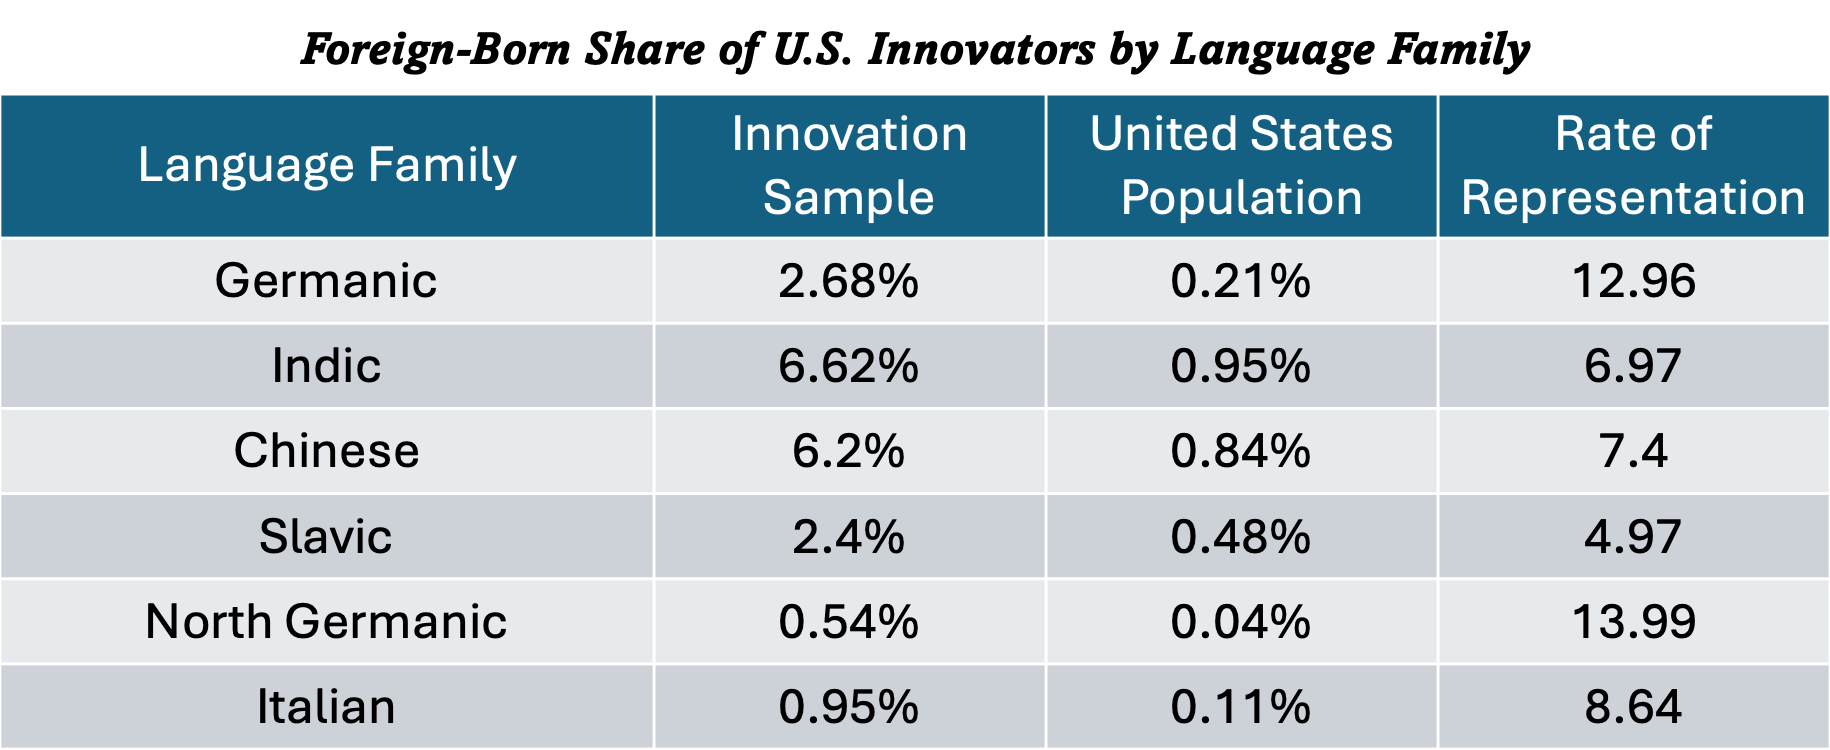
Note however that the authors suspect that the values might be underestimated for Chinese. This is because, according to them, their language model NamSor API estimated that 9.8% of the total sample of innovators had names of Chinese heritage (encompassing origins from China, Hong Kong, Mongolia, and Taiwan). However, only 6.6% of actual survey respondents were predicted to have Chinese heritage. This indicates that individuals with Chinese names responded at a 50% lower rate than expected, creating “a significant response bias that underrepresents names guessed to be of Chinese origin” (p. 18). If one were to take the values predicted from NamSor API rather than the survey responses, then the rate of representation for Chinese increases to 10.9950398, which is remarkably high. In all likelihood, this should be considered the upper bound for what the true rate is for Chinese. They also noted a minor discrepancy with the Indic language family as well but it wasn’t statistically significant.
The one rather surprising result here is with Slavs, as they performed worse than the Indic language family. I am unsure as to why this is the case. Since this method simply relies on dividing the foreign-born share of innovation of a given language family by its foreign-born population share, all the language families here have values above 1, probably because they look good compared to Africans and Hispanics.
Also, note that it is hard to apply their method for second generation immigrants and beyond because of language shifts and name changes that occur, and this sort of acculturation differs in how pronounced and quickly it occurs among different immigrant groups (see, for example, Abramitzky et al., 2017).
References
Abramitzky, R., Boustan, L. P., & Eriksson, K. (2017). Cultural Assimilation during the Age of Mass Migration. NBER Working Paper, No. 22381.
Nager, A., Hart, D. M., Ezell, S. J., & Atkinson, R. D. (2016). The Demographics of Innovation in the United States. Information Technology & Innovation Foundation.