


Racial Economic Discrimination in America After the Civil War: Was It Really So Bad?
Doesn't seem like it


By 1860, there were four million slaves in America (Hacker, 2020). Five years later, all of these slaves were freed with the ratification of the 13th amendment, and were forced to compete against other free workers. This post analyzes several lines of evidence for economic discrimination against blacks (or the lack thereof), focusing mostly on the time between ~1880 and ~1964, when the Civil Rights Act was signed by Lyndon B. Johnson.
1880-1920
Twenty five years after four million unemployed blacks joined the free labor market, Labor Bureau data showed that the black unemployment rate (that is, the percent of blacks that wanted to find work but couldn’t) was equal to the white rate (Vedder & Gallaway, 1992)—4.41% for whites and 4.07% for non whites. Indeed, Robert Higgs (1977a, pp. 40-41) reports that employment rates were significantly higher for blacks than for whites in 1890:
The Census of 1890, the first to make racial distinction in the returns pertaining to occupations, revealed that of the black population 10 years and over, 79 percent of the males and 36 percent of the females were gainfully employed…For whites the proportions at work were smaller, the percentages being 77 for males and 14 for females. Considering both sexes together, 58 percent of the blacks and 47 percent of the whites were gainfully occupied.
How were blacks able to secure employment? There is some evidence in this regard from large scale interviews of ex slaves, completed in the 1930s, known as the Slave Narratives. The most comprehensive study of these narratives is Paul Escott’s Slavery Remembered: A Record of Twentieth-Century Slave Narratives (1979). He found that, of the several thousand narratives, a little under 1600 mentioned whether or not they stayed on their master’s property after the Civil War to work as free laborers. Excluding those who stayed during the war (87, or 5.5%), those who left after an indeterminate amount of time (304, or a little over 19%), and those that are categorized by Escott as “[l]eft but returned” (22, or 1.5%), it is found that 43.7% of slaves stayed on their master’s land for three or more years after they were freed (calculated from p. 137, Table 5.2). 745 slaves mentioned a reason for leaving or staying for how long they did. Of those who were categorized as staying with their master for an extended period after emancipation, the most common reason was liking the master or liking their job (66.8% of those staying; calculated from p. 138, Table 5.3). Therefore, many blacks were able to secure a job soon after emancipation, with bosses who, at least in their judgement, would be favorable to them. However, most blacks, by the late 19th century, were probably not employed by their former masters. Instead, they either started their own farms or worked on other people’s farms.
How much poorer were blacks than whites in 1880? According to Ng & Virts (1993), the average black’s annual income was around a third (34%) of the white annual income. However, this number is misleading for several reasons: the two races differed in terms of age and sex distribution; the two races differed in terms of which parts of the country they lived; and, lastly, it is important to note that this figure includes income from sources outside of employment (e.g., stocks), which has no bearing on the question of economic discrimination. When Ng & Virts controlled for age and sex by only looking at men above the age of 15, controlled for where they lived by looking at specifically the rural South, and excluded all non labor income from their calculation, the datum becomes that blacks earned 89% as much as whites (see p. 14, Table 2). This difference is quite small, and there is no reason to assume that it is not caused by factors such as differences in productivity, what jobs and positions they had, seniority, etc.
In 1887, the North Carolinian Bureau of Labor Statistics published its first report. Part of this report was dedicated to presenting the answers to a survey of land owners and their laborers/tenants, each county being represented by one member of each group. Robert Higgs (1978) analyzed the responses to a specific question asking if the wages paid to black workers were different than those paid to white workers. Of land owners, only one said that blacks were typically paid a lower wage; of the laborers/tenants, 77 said that the two races were normally paid the same wages, 7 said that some blacks were paid lower wages, one said that the difference was “20 p. c.” (20 percent), and one response was indecipherable (p. 310). Therefore, a survey of a large southern state’s population (though the respondents were probably all or mostly white) shows that the common view was that blacks got paid an equal wage to whites.
An earlier paper by Higgs (1972) reported results from an Agricultural Census of all sixteen Southern states, at the end of the 19th century. These data show that, during the ordinary seasons, whites perhaps made something like 9% more than blacks, and that, during harvest labor, this figure is closer to 8%. Higgs notes that this difference may be completely explained by the fact that blacks often received greater compensation in terms of board: “Yet even this small gap probably overstates the difference between the real wages of the two races, for apparently black laborers typically received substantial compensation in kind that their white counterparts did not” (p. 327). A picture of Higgs’ estimates is given below.

Another paper by Higgs (1977b) looked at wage differences between blacks and whites working in various firms, for the years 1900 and 1909. In 1900, when firms hired both blacks and whites, whites on average got paid more than the blacks in 36 percent of the firms, while both races got paid the same wage in 61 percent of them. In 3 percent of the cases, blacks got paid more. This means that, even in 1900, two thirds of firms did not show any preference toward whites, even if any average wage differential is enough to prove discrimination. In 1909, 62% of firms that hired both blacks and whites either did not show any average difference between the two races’ average wage rates or showed a preference toward blacks, with the remaining 38% of firms paying whites more on average. When looking at specifically unskilled labor, in which racial differences in productivity would not be as high, 74% of firms paid equal or higher wages to blacks in 1900. In 1909, that figure was 70%.
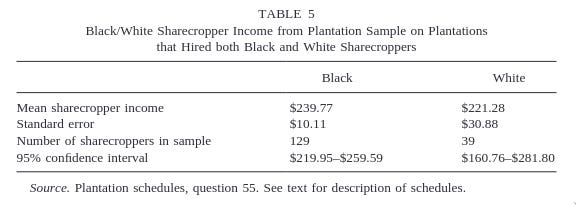
Alston & Kauffman (2001) examined evidence from 39 Georgian plantations, collected by the Census Bureau in 1911. The researchers compared white and black sharecroppers’ average wages, and found no difference. When comparing whites and blacks in the total sample, the blacks earned, on average, $205.48 annually, compared to a white rate of $208.54 (the difference is not significant). When comparing blacks and whites who worked on plantations that hired both blacks and whites, the average wage for blacks was actually slightly (though insignificantly) higher: $239.77 as opposed to $221.28 for whites.
I am aware of only one study during this period that used individual level data and tried to control for major variables. Economists Bradley and Mary Hansen (2006) titled their paper “New Evidence on Race Discrimination under ‘Separate but Equal’”. They used data of Virginia teachers’ salaries in 1906, and found that the average black teacher made only 67% as much as the average white teacher did in cities. In rural counties, the difference was slightly smaller, with blacks on average making 70% as much as whites did. However, the authors also added two variables: education (college graduate, normal school graduate), and what kind of teaching certificate the teacher had. Teaching certificates were given based on a standardized test. When the authors controlled for these two variables, about two thirds of the within group variation in wages was explained. However, it was clear from the data that blacks benefited much less from an increase in education, and slightly less in an increase in the quality of their certificate. Notwithstanding, a look at the table, which I appended below, makes it clear that the difference in certificates’ incremental value is not very large; in cities, there was no difference for first grade certificates, and a difference much lower than the standard error for the second grade certificate. For the rural counties, there was basically no difference for the first grade certificates, or for the second grade certificates; for the special and emergency certificates, there was a large difference, but the special certificates were not very common (see Hansen, B. A., & Hansen, M. E., 2006, p. 125, Table 1), and the emergency certificates’ incremental validity is very low for both races—and, indeed, the difference between them, in the model which controls for the average age of teachers in the county, becomes smaller than the standard error.

Furthermore, it should be noted that college for blacks did not mean the same thing as it did for whites, especially back then. One can easily find old studies that discover intelligence differences between black and white college students that are as large, or larger, than those found in the general population. Much of this evidence was reviewed by Audrey Shuey in his The Testing of Negro Intelligence (1966). Speaking of dozens of studies carried out from the early 20th century to the 1960s, he wrote that several conclusions could be reached (p. 307):
1) the low scoring of colored students in institutions of higher learning for Negroes, 2) the inferior showing of Negroes attending mixed Northern universities as with whites in the same universities, [and] 3) the unfavorable averages of colored [students] coming South to colleges from mixed Northern secondary schools as compared with the norms…
Furthermore, it is known that black colleges were not as consistent in terms of what kind of students they admitted; some of the best black colleges admitted many bad students, and some of the worst colleges admitted many good students. In the 1930s, for example, a very detailed report written by a famous African American Civil Rights advocate named Ambrose Caviler (1933) for the U.S Office of Education, stated the following in its conclusion (p. 104):
There is a serious lack of selectivity in Negro colleges as shown by the heterogeneity of the student bodies. [paragraph break] This dissimilarity is seen in the scholastic aptitude of students. Although there is a consistent and pronounced difference in the median scores made by students of different colleges, practically every grade of intelligence is represented in each college, some of the brightest students being found in many of the colleges having the lowest average scores, and some of the dullest being found in those having the highest average scores.
Therefore, a plausible explanation for why greater education did not increase the income of blacks’, on average, as it did for whites, is that college simply meant a different thing for blacks than it did for whites. After all, it is known that about half of the positive effect that education has on income is due to underlying ability (e.g conscientiousness, intelligence), and perhaps another half of what is left is due to being able to better signal underlying ability (see Caplan, 2018).
Not only that, but the inability of even relatively elite black colleges to guarantee that their students aren’t poor scorers may have caused a type of market failure, sometimes called a lemon market (see, e.g, Harford, 2006, ch. 5). In this market, the seller has more information than the buyer, and the buyer knows about this imbalance, but has no way of controlling it. The seller knows whether or not his product is worthless, and the buyer knows that there is no way for him to know whether or not it is without paying for it. This leads to the buyer either not valuing the product at all, or to valuing it significantly less than if he were certain that it were not worthless. The seller is, then, not able to sell his product—either it is priced at zero, in which case selling it only wastes his time, or it is priced so low that it is only worth selling it if it were useless, leading to nobody buying it, as they expect it to be worthless. When it comes to education, this applies, with only a slight nuance: selling education is free, because you are not literally selling it, which means that selling it at a low price, or even for free, does no harm to the person who has received an education, if the situation is really such that opportunity cost for doing so is zero.
Put simply, the person looking for work is the seller, and his prospective employer is the buyer. If the job searcher is black, and has graduated from a prestigious black university, his goal is to “sell” his education in order to get an increased wage; if he fails, his chance of being hired, or his wages if he does get hired, are unaffected by his diploma. The black man knows whether his diploma is useful or useless (that is, if it really accurately represents his underlying ability), but the employer does not. Therefore, the employer has to somehow adjust for the fact that he cannot guarantee that the black man was 1) qualified to go to college at all, and 2) that he was qualified to go to the specific college that he went to. If the allowance to be made for a possibly near worthless college degree was larger for blacks than for whites—and I believe it was—then the premium given by employers to blacks’ being college educated would necessarily have to be lower.
Those in charge of teachers’ salaries, then, seem to have accurately reacted to the type of market created by lax standards for black universities generally, and for elite universities relative to non elite universities. There is no reason to believe that Hansen, B. A. & Hansen, M. E.’s (2006) data is better explained by racial prejudice than by economic theory.
1920-1964
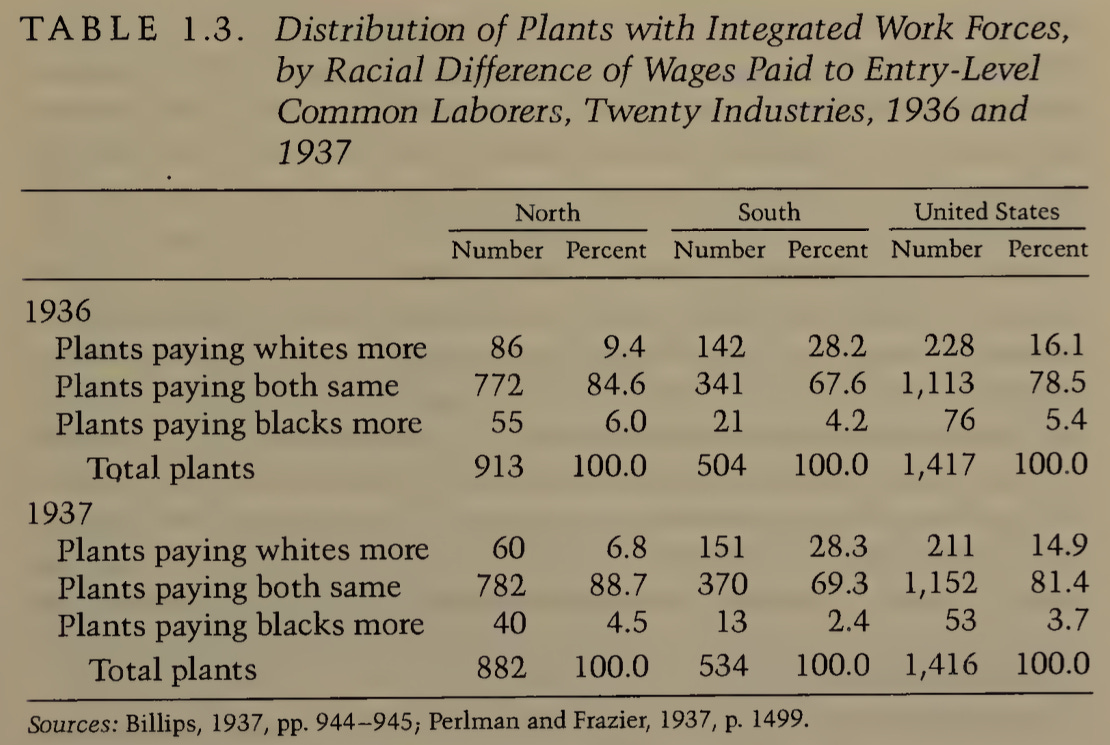
In a book chapter, Higgs (1989) presents data from the U.S Bureau of Labor Statistics for the years 1936 and 1937, for a little under a thousand factories, for each year, that hired both blacks and whites. In the North, in 1936, 90.6% of factories paid blacks the same or a higher wage on average; in the South, for the same year, 71.8%; and, in the U.S as a whole, 83.9%. In 1937, 93.2% of the northern plants paid blacks the same amount or more; in the South, 71.7%; and, in the entire U.S, 85.1%. The vast majority of factories, then, did not pay blacks any less than whites on average. In fact, as can be seen from Higgs’ data, shown below, northern factories were about as likely to pay blacks more on average as they were to pay whites more on average.
By far the most interesting study I have been able to find was published by Roy Mill and Luke Stein (2016). In the 1910 Census, many black children were classified as Mulattoes—that is, racially mixed people who are half white and half black. In the 1940 Census, the term mulatto was discarded; all of those who used to be labeled as mulatto had to, then, be labeled as either white or black. Mill and Stein collected a dataset of brothers who were labeled as Mulattoes in 1910, but then as different races in 1940—e.g, if John and Jack Doe were both Mulattoes in 1910, but, in 1940, John was labeled as white, and Jack as black. The authors then saw if incomes were higher in 1940 for the brother labeled as white. The difference between the black and white labeled brothers would, then, be a rough estimate of the premium of being able to “pass” as white. The authors write: “Mulattoes who passed for white earned 31-42% more than non-passers” (pp. 5-6). However, this is misleading, because they compared all white passers against all black passers, and not white passing brothers against black passing brothers. When comparing brothers, “[p]assers earned 14-21% more than their brothers who did not pass” (p. 6). Even this much smaller premium is misleading. Mill and Stein’s (p. 41) main table presents the following results:

For weekly total income, the p values are below .1, above .1, and below .05, respectively, for the three columns. None of these are impressive, and the only one that would, under normal circumstances, be taken seriously was for the last column, which actually found a sizable negative effect of passing as white on income after controlling for years of education and for the interaction between passing as white and education (i.e., accounting for differences in the premium of education for blacks as compared to whites, as discussed above, which would actually be the result of rational, economic thinking, and not necessarily racism). To be clear, I do not believe that any of these effects are real, or, at least, that they should be considered to be real based on this evidence, including the column suggesting that passing as white was a bad thing for weekly income. For the weekly labor income category, the story is the same: the p values for the three columns were above .1, above .1, and below .05, respectively, with the only statistically significant effect being highly negative. Once again, I do not believe that any of these effects should be taken seriously. The most reasonable interpretation of this study, then, is that there was no significantly negative effect of people knowing that you’re black on your economic success in of itself.
Finally, Jonathon Leonard (1984) examined data on millions of manufacturing workers from 1966. He found that non white manufacturing workers were 68% as productive as white worker. How much did they earn relative to whites? 69% (p. 162). Blacks, therefore, did make significantly less than whites, but their earnings relative to whites perfectly matched their relative productivity.
Conclusion
It is well known today by psychometricians that the relationship between race and income is almost entirely mediated by intelligence differences between races, this fact being replicated in studies of large databases with thousands of blacks and whites (e.g Herrnstein & Murray, 1994, ch. 14; Kirkegaard, 2018). If intelligence today explains most of the differences in income between racial groups, it is silly to think that the difference is caused by some form of discrimination. But was this always the case? According to the data that I have been able to find, it seems to have been, at least from the late 19th century onward. Black people in the same location and in the same position earned the same wage most of the time. This was particularly so for unskilled labor like 1930s factory work and primitive farming using old technology (for the fact that technology used in the early 20th century South was outdated even at that time, see, e.g., Ferleger, 1998, esp. pp. 142, 156-157). When it came to more skilled occupations, such as early 20th century teachers, and manufacturing workers in the mid 1960s, there were wage differences of around the magnitude of 30%, but there is no reason to believe that this difference was caused by anything other than a difference in productivity, and, in fact, this was definitely the case for manufacturing workers in 1966, as they were paid exactly proportionately to their relative productivity. Finally, the only two studies that tried to use sophisticated statistical techniques to prove the discrimination hypothesis ended up either providing strong evidence that there was no difference, or did not provide enough evidence for either the alternative or the null hypothesis.
References
Alston, L. & Kauffman, K., (2001). Competition and the Compensation of Sharecroppers by Race: A View from Plantations in the Early Twentieth Century.Explorations in Economic History, 38: 181-194.
Caliver, A., (1933). A Background Study of Negro College Students. Office of Education, United States Department of the Interior.
Caplan, B., (2018). The Case Against Education: Why the Education System Is a Waste of Time and Money. Princeton University Press.
Escott, P., (1979). Slavery remembered: A Record of the Twentieth-Century Slave Narratives. University of North Carolina Press.
Ferleger, L., (1998). The Problem of "Labor" in the Post-Reconstruction Louisiana Sugar Industry. Agricultural History, 72: 2, 140-158.
Hacker, J., (2020). From “20. and odd” to 10 million: The Growth of the Slave population in the United States. Slavery Abolition, 41: 4, 840-855.
Hansen, B. & Hansen, M., (2006). New Evidence on Race Discrimination Under “Separate But Equal.” Essays in Economic & Business History, 24: 120-132.
Harford, T., (2006). The Undercover Economist: Exposing Why the Rich are Rich, the Poor are Poor, and Why You Can Never Buy a Decent Used Car!. Oxford University Press
Herrnstein, R. & Murray, C., (1994). The Bell Curve: Intelligence and Class Structure in American Life. Free Press.
Higgs, R., (1972). Did Southern Farmers Discriminate?. Agricultural History, 46: 2, 325-328.
Higgs, R., (1977a). Competition and Coercion: Blacks in the American Economy, 1865-1914. Cambridge University Press.
Higgs, R., (1997b). Firm-Specific Evidence on Racial Wage Differentials and Workforce Segregation. The American Economic Review, 67: 2, 236-245.
Higgs, R., (1978). Racial Wage Differentials in Agriculture: Evidence from North Carolina in 1887. Agricultural History, 52: 2, 308-311.
Higgs, R., (1989). Black Progress and the Persistence of Racial Economic Inequalities, 1865-1940. in S. Shulman & W. Darity (Eds.), The Question of Discrimination: Racial Inequality in the U.S Labor Market (pp. 9-31). Wesleyan University Press.
Irwin, J., (1990). Farmers and Laborers: A Note on Black Occupations in the Postbellum South. Agricultural History, 64: 1, 53-60.
Kirkegaard, E., (2018). Cognitive meritocracy is the main cause of racial income gaps in the United States: an analysis of 5 large datasets. Accessed at: https://osf.io/6rkst/#!.
Leonard, J., (1984). Antidiscrimination or Reverse Discrimination: The Impact of Changing Demographics. The Journal of Human Resources, 19: 2, 145-174.
Mill, R. & Stein, L., (2016). Race, Skin Color, and Economic Outcomes in Early Twentieth-Century America. Available at SSRN: https://ssrn.com/abstract=2741797 or http://dx.doi.org/10.2139/ssrn.2741797
Ng, K. & Virts, N., (1993). The Black-White Income Gap in 1880. Agricultural History, 67: 1, 1-15.
Shuey, A., (1966). The Testing of Negro Intelligence, Second Edition. Social Science Press.
Vedder, R. & Gallaway, L., (1992). Racial Differences in Unemployment in the United States, 1890–1990. The Journal of Economic History, 52: 3, 696-702.
1) The Union abandoned Reconstruction because black run southern governments worked about as well as Detroit and Baltimore today.
2) One of the worst immigration stories on the 20th century was The Great Migration of blacks from south to north which destroyed the rust belt in the long run (as well as some NE cities like Philadelphia, Newark, or Baltimore).