


How Bad Was Anti-Black Discrimination in the Past?
A detailed look at the evidence

This is the full-length version of the article published on Aporia Magazine.
Today, there is considerable debate about whether widespread economic discrimination against blacks exists or not. Scientific research has continually demonstrated that it does not (Last, 2022; Wright et al., 2024). The reason black people underperform relative to whites today is simply because they are less productive workers, whether this is measured subjectively (e.g., supervisor ratings) or objectively (for a meta analysis, see Roth et al., 2003), because of lower average cognitive ability (Herrnstein & Murray, 1996; Murray, 2021), and because of several other, less major reasons, such as their being younger on average. The fact that economic discrimination against blacks is not common today is a relatively mainstream belief, held even by public figures like Ben Shapiro. A much less common view is that there has never, in American history, been a time where economic discrimination was widespread. This is the view which is argued here.
This essay is divided into five main parts as well as three appendices. The first part will introduce the reader to important historical statistics on black-white differences in income and related measures, and discrimination will be defined. In the second, theoretical weaknesses in the hypothesis that discrimination was a major driver of economic differentiation between races will be discussed. In the next two parts, empirical evidence on the extent of discrimination will be presented. Finally, the fifth part concludes. The appendices discuss analyses done by other authors which either do not directly fit into the theme of this essay, or are too technical to be part of the main text.
CONTENTS
Part I: Introduction
Trends in Income, Employment, and Occupational Status
If it is thought that employers discriminated against blacks, then an expected outcome would be that blacks were both more likely to not be employed and more likely to be unemployed (unemployment being defined as looking for, but being unable to find, a job, while not being employed simply means not having one, irrespective of its being sought). While unemployment rates for blacks and whites differ significantly today, this was not the case until the 1940s and ‘50s (for a discussion, see Murray, 1984, ch. 5). Indeed, according to Robert Higgs (1977a, pp. 40-41), the 1890 Census showed that 58% of blacks and 47% of whites were “gainfully occupied”, with most of the difference being due to a much higher rate of black women working than white women working (for men, the employment rates were 79 and 77 percent for blacks and whites, respectively). Unemployment rates from 1880 onward are provided by Fairlie & Sundstrom (1997; see also Vedder & Gallaway, 1992).

The data on employment, then, are not consistent with a high impact of discrimination, given that the gap was close to zero in the late 19th century and early 20th century, when prejudice was highest, but increased in the ‘40s and ‘50s, when prejudice was rapidly declining.
Furthermore, the available data show that, between 1910 and 1950, there was almost no change in the relative occupational statuses of blacks and whites within the same region (Becker, 1957):

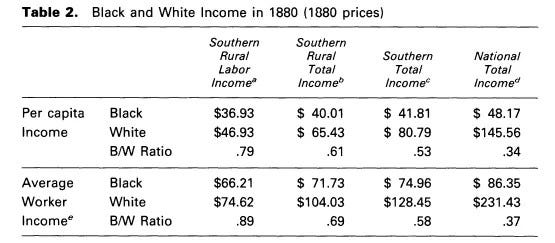
More data is available regarding wages. For 1880, Ng & Virts (1993) report that the income ratio between Southern blacks and whites was 0.53, meaning that the average black Southerner had an income 47% lower than the average white Southerner. Since 1940, income data has been available for all regions, and a time series has been constructed by Bayer & Charles (2017, Appendix). In 1940, Southern blacks earned 58.3% less than Southern whites, meaning that the gap actually widened in the intervening sixty years! (The table below uses natural logs, meaning that setting e to the power of the coefficient in a given cell tells you what percentage of the median white income was earned by the median black in that specific year and region.) A comparison of the first and last rows in the table shows that, in all regions but the South, blacks have gotten poorer relative to whites between 1940 and 2014. The widening of the gap between 1940 and 2014 is, of course, nonsensical if economic discrimination is the main reason for black underperformance in the economy. The decreasing gap in the South between 1940 and 2014 could be taken as support for the discrimination hypothesis, but the fact that the income gap was lower in 1880 weakens that argument.

However, this information is not, of course, enough to conclude that economic discrimination against blacks was rare. It is only strongly indicative. What is necessary is such data as wage rates for blacks and whites at the same occupation, at a given time. Much of this kind of data has been collected, and is considered in Parts III and IV.
Definitions
Before proceeding with this analysis, it is necessary to define what is and is not discrimination, and how its effects could be measured. Gary Becker’s (1957) The Economics of Discrimination, will here serve as a guide for these issues. He defines discrimination as occurring when an economic actor loses or forgoes the gain of something with economic value in order to act on his prejudice or racial preference. (Terms such as preference and prejudice will be used interchangeably in this essay.) The extent of economic discrimination against a given group is measured by how much the average member’s of that race’s income is reduced, relative to the average member of the other race, by the totality of discrimination in the market. Wages will be depressed by economic discrimination because the difference between black productivity and wages must be larger in order to be hired by someone with a prejudice against them.
Economic segregation and economic discrimination are often confused, though they are distinct, as it is possible for an entire business or industry to exclude a race without depressing its income (Becker, 1957, pp. 49-50; Whatley & Wright, 1994).
This model applies to discrimination by individuals only. In order to estimate the discriminatory effect of government policy, two things must be shown: 1) that the action was motivated by racial prejudice, and 2) that it resulted in a decrease in black wages relative to white ones. Such discrimination will be referred to as government discrimination.
A Note on Qualitative Evidence
In this post, I will base my conclusions on the weight of the available quantitative evidence. This is in contrast to many economic historians, especially those writing about racial discrimination, who have largely relied on qualitative, impressionistic evidence. I believe that this is a mistake as qualitative evidence is not only more laborious to obtain (one will often, for example, read through hundreds or thousands of pages just to get one or two sentences worthy of quoting) but is also less conclusive, as it is difficult to gauge its degree, even if it were proved that such effect from discrimination did exist. In the words of Lord Kelvin, “When you can measure what you are speaking about, and express it in numbers, you know something about it; but when you cannot measure it, when you cannot express it in numbers, your knowledge is of a meager and unsatisfactory kind”.
This lack of satisfaction is as evident in the impressionistic evidence for economic discrimination in the past as it is in any other field. Despite its age, the most extensive review of the qualitative evidence, based on written statements from the time, can be found in Stephen DeCanio’s Agriculture in the Postbellum South (1974), where it is said that “a strong case can be built on either side”—both for profuse discrimination, and for a competitive market where there was little taste for race (p. 16). DeCanio demonstrated this fact by first writing at length in support of the discrimination hypothesis (pp. 16-51), and then doing the same on behalf of the opposing view (pp. 51-76). It is worth quoting his concluding words on the topic:
Traditional historical methods simply cannot resolve the postbellum Southern agricultural system sufficiently to distinguish which of the major alternative hypotheses were true in the aggregate ... Clearly, if further progress is to be made toward understanding these historical problems, more powerful techniques [than analysis of impressionistic evidence] must be developed and applied. (pp. 118-19)
Part II: Theoretical Issues
Attitudes Versus Action
The economist Gary Becker (1957) famously made the point that prejudice does not always lead to discrimination. If discrimination is thought of as a preference, individual acts of discrimination by employers are trade-offs between economic value and non-economic value. If applicant A, who is black, can produce $100 of economic value per hour, while applicant B, who is white, can produce $90, the cost of favoring applicant B could be astounding; if he works for forty hours a week for a fifty week year, acting on your prejudice will have cost you $20,000! Milton Friedman (1962, p. 110) restates this logic as it relates to decisions apart from hiring employees or serving customers:
This same phenomenon is of much wider scope. It is often taken for granted that the person who discriminates against others because of their race, religion, color, or whatever, incurs no costs by doing so but simply imposes costs on others. This view is on par with the very similar fallacy that a country does not hurt itself by imposing tariffs on the products of other countries. Both are equally wrong. The man who objects to buying from or working alongside a Negro, for example, thereby limits his range of choice. He will generally have to pay a higher price for what he buys or receive a lower return for his work. Or, put the other way, those of us who regard color of skin or religion as irrelevant can buy some things more cheaply as a result.
The fact that economic interests can dissuade people from acting on their prejudices was best shown in an early study by Richard LaPiere (1934; see also Dockery & Bedeian, 1989). LaPiere asked 81 restaurants and 47 hotels if they would accept a Chinese person as a guest. Only one hotel and zero restaurants said that the Chinese would be admitted, while several of each were undecided. In all, 91.5% of hotels said that they would refuse a potential Chinese guest, along with 92.6% of the restaurants. He then spent a few years visiting each of the hotels and restaurants with “a young Chinese student and his wife,” neither of which knew that he was conducting a study (p. 231). Of all of the businesses visited, only one did not accept the couple, and in only a handful of instances was the “reception perceptibly hesitant” on what was deemed likely to be “‘racial’ grounds” (Table II). The reason that such a result can be obtained is obvious. When answering a survey, the potential negative consequence of saying that Chinese customers would be refused is much smaller than the potential consequence of actually refusing those customers. In effect, purporting to engage in discrimination when answering an anonymous questionnaire is a very cheap way to express a dislike of Asians; turning away Chinese customers is an expensive one.
The Extent of Prejudice
Was prejudice against blacks so strong that individuals could deem the costs of discriminating worth it? It is difficult to tell, of course. Becker (1957) himself believed that “the extent of discrimination in the market place in this country is probably much less than in almost every other country in the world” (p. 1), though still thought that it had a large effect.
In the early 20th century, the black sociologist DuBois (1904) surveyed 534 young black Georgians (aged 13-21) as part of his report on “Negro Crime,” asking why they believed “so many Negroes” were “under the clutches of the law.” The response data have been collated in a more readable form in a short paper by Shaun Gabbidon (2000). His figures show that, of the 438 who responded, only 19 (4.3%) blamed racial discrimination. This is the only such poll of which I am aware that precedes the end of the second world war. What is to be made of it? Of course, to tout it as incontrovertible evidence for a lack of discrimination would be a mistake, but dismissing it completely would, I think, be a much greater error.
In 1946, the National Opinion Research Center asked, “Do you think most Negroes in the United States are being treated fairly or unfairly?” Only 28% of black respondents said that they were treated fairly, and another 66% said that blacks typically were not treated fairly. 6% did not know the answer. Of the whites who responded to the same question, the results were reversed: 64% said that blacks were usually treated fairly, 27% said unfairly, and 9% did not know (NORC, 1947). It should be noted that these results are similar to what was found in a recent Gallup poll, where 60% of whites thought that blacks were not less likely to get a job for which they were equally qualified, compared to just 31% of blacks. Therefore, these results can be found even when there is, in fact, little to no discrimination (as is currently true).
Although attitudes do not necessarily translate into actions, as explained earlier, it would still be useful to look at the nature of prejudice. Mildred Schwartz (1967) has reported data on white attitudes toward blacks going back to the 1930s. An example is surveys asking whites if they believe that whites and blacks are equally intelligent; 42% answered yes in 1942, that figure being 78% in 1956. This trend is similar for every type of question Schwartz analyzed: in the 1930s and 1940s, the majority held a prejudicial view (although, of course, in the case of intelligence they were simply correct), and, by the ‘50s and ‘60s, the vast majority held the non prejudicial view. The most relevant question is whether whites should receive preferential treatment (see also NORC, 1947). In 1944 and ‘46, fewer than half believed that whites and blacks should be treated equally by employers. By 1963, over 80% responded that way.
Becker (1957, ch. 4) also noted that employees’ prejudice can discriminate by refusing to work with blacks. This would create a situation in which employers would be losing certain white employees when they hired blacks, which would, then, sometimes make discriminating against equally or more qualified blacks the more economically efficient decision. However, even in this case, the employee would only be able to act on his prejudice by quitting his job upon being met with a black coworker if his desire to avoid working with blacks must be very strong, as it would require him to forfeit his current wage and search for new employment. Several surveys can be analyzed to see to what extent employees were willing to work with blacks, at least in their own words. These are all taken from a collation of national surveys by Hazel Erskine (1968, pp. 136-138):
In a 1942 survey, high schoolers were asked if they were willing to work with blacks “if they had an equal position to yours and worked side by side with you.” In the whole sample, only 21.4% said that they would refuse such a job, but this figure was 49.3% in the South.
In a 1945 poll, 25% of adults who were laborers said that they would refuse to work alongside blacks in a question which was worded in the same way, as well as 19% of farmers.
In a different 1942 poll, 55% were willing to work alongside a black person “in an office or factory,” 39% were unwilling, and 6% did not know.
In 1944, 51% of respondents said that they would be alright “If a Negro with the same training had the same kind of job as you at the place where you worked,” 43% said that they would not like it, and 6% could not decide.
A 1958 survey found that 79% of Northern whites were “willing to work next to members of the other race,” while 17% were unwilling and 4% did not know. Southern whites, on the other hand, were willing in 48% of cases, unwilling in 46%, and did not know in 6%.
The same poll also found that 88% of Northern whites would work for an employer who also hired blacks, while 17% were not. 4% were undecided. Of the Southern whites, 77% would work for one, 18% would not, and 2% did not know if they would.
In 1963, 31% of Southerners said that they objected to working alongside blacks, compared to 14% of Northerners.
In 1965, the same question was asked again. This time, only 24% of Southerns and 7% of Northerners objected.
From these surveys, it can be seen that, although a considerable number of Southern employees were against working with blacks, they were not as adamant about this as with other questions asking them of their prejudices. It seems, then, that employee discrimination is a weaker part of the hypothesis.
Another pertinent datum comes from a survey of Louisianan firms that employed members of both races, which included a question asking whether their employees of a given race were more or less willing to work with the other race (Wilson & Gilmore, 1943, Table 3). Of the 113 employers who answered this particular question, 64.6% believed that there was little difference between blacks’ willingness to work with whites and whites’ willingness to work with blacks. 29.2% said that blacks were less opposed, and 6.2% said that whites were more willing. This suggests that whatever employee discrimination did exist was not much more likely to come from the whites as it would from the blacks.
Indeed, this is expected, as racial animosity went both ways. A study of 219 black World War II veterans, for example, found that 75% entered into service “with negative attitudes toward Whites” (Roberts, 1953, p. 66). A recent meta analysis examined trends in viewers’ racial preferences as betrayed by their reactions to commercials, going back to 1956 (Lenk et al., 2024). The authors found that, although whites in the past had a sizable anti-black bias, it was never as large as blacks’ anti-white bias.
While it is difficult to know if the level of prejudice was sufficiently high in the past to cause economic discrimination, the data presented here certainly make it seem plausible. It will be the purpose of the next part to determine if such discrimination did, in fact, occur. It should be cautioned that, because black attitudes toward whites were also unfavorable, anti white discrimination may have occurred. In the remainder of this essay, I will ignore this possibility.
Part III: Government Discrimination
Economic discrimination could also be committed through government policy. In this section, evidence is given regarding several of the most commonly cited government policies. I conclude that none can be proved to have been caused by racism, and only one may have had an impact on black incomes relative to white incomes.
Education
One type of government discrimination that is often invoked concerns differences in school quality. Evidence regarding school quality is available from Robert Margo’s Race and Schooling in the South, 1880-1950 (1990). In 1890, there was little difference in funding in a few Southern states, but large differences in others. By 1950, however, most states were relatively equal. Data from outside Margo’s study suggests that, by the early 1970s, up to today, there has been no difference in funding (Richwine, 2011; Reuben & Murray, 2008). Between 1890 and 1950, however, there were large differences–with whites in the same state sometimes getting as much as five times the funding per capita. In other words, school funding followed a U shaped pattern, although it ended up being more even at the right side of the U. The patterns for other school quality measures like school days per year and pupil-teacher ratio retain this same shape, but with the left side of the U reaching about the same height as the right side. Remember that two things must be true to demonstrate the existence and magnitude of government discrimination: 1) it must be motivated by racial prejudice, and 2) it must have reduced the economic wellbeing of blacks relative to whites.
First, it’s important to look at the motivation for differential school funding. The two states whose history in this regard has been written up at length are North Carolina and Louisiana.
North Carolina has been extensively studied by Kousser (1980). According to his data, the black-white per capita education expenditure ratio was 1.05 in 1880-85, but decreased to about 0.9 in 1886-1890, where it stayed until 1900. In 1901-05 and 1906-1910, the same ratio was 0.59 and 0.4, respectively. It should be noted that, technically, black school expenditure did not decrease. In fact, it increased by almost one third between 1900 and 1910. The issue, then, is how quickly the funding increased for whites. If the motivation were racism, would black education have increased in funding?

So, what, according to Kousser, caused the decline in expenditure ratios? He writes that, while it was a “Radical Republican notion” that educational spending should not vary by race, “Many North Carolina Democrats, especially after 1900, espoused another [notion] ... Contending that one should receive in proportion to what one pays, these Democrats sought ... to force black schools to operate on taxes raised from blacks and, by increasing the proportion of funds for schools raised at the local level, to allow whites living in rich areas to better themselves without sharing their largess with whites who lived in areas where almost everyone was comparatively poor” (p. 182).
Therefore, the main reason for the decline was, apparently, Democrats’ desire to avoid redistributing wealth from whites to blacks, and from the rich to the poor. In order to test to see if this is really what occurred, Kousser calculated the “black balance of payments,” that is, the difference between their share of the education and their portion of taxes paid, for these periods, finding that, indeed, there was a very large decline. But, even in the two later periods, blacks still received substantially more in education funding than they were owed based on their total tax contributions!

It is, of course, possible that racism played a part in the government’s decision to no longer redistribute white tax money to black schools (Kousser believed that it did), but what occurred between 1900 and 1910 can be just as easily explained without appealing to lawmakers’ prejudices.
Louisiana’s story, as told by Margo (1982), was similar. While in 1890 white per capita school funding was already twice as high as black funding, that figure increased to over 5.5 times by 1910. Margo proposes two main hypotheses: 1) because the share of black people who met the criteria necessary to vote declined greatly between these two points in time, it is possible that the school board did what was in its best interest as an elected body, and redistributed resources in favor of the race which had more votes; and 2) in the same way as in North Carolina, there may have been “powerful ideological reasons why those who bore a large share of the tax burden believed they should receive an equivalent share of government output” (p. 18). Neither possibility involves racism directly, although, of course the former may have been indirectly caused by racism if prejudice were the cause of blacks’ loss of suffrage during this period. The best study of black suffrage during this period is still J. Morgan Kousser’s The Shaping of Southern Politics: Suffrage Restriction and the Establishment of the One-Party South, 1880-1910 (1974), and the massive amount of impressionistic evidence in it seems to suggest that prejudice did play a part, although probably a more minor one than strict politics. (For the dangers of relying only on impressionistic evidence, see above.)
Margo (1982) used county level data for 1890 and 1910 to test the above theories. He concluded that:
the results of the regression suggest that disenfranchisement reduced expenditures on black schools, enabled whites to take fuller advantage of the fiscal mechanisms outlined above, and led to a racial distribution of school spending that more closely approximated the racial distribution of the taxable resources. (pp. 28-29)
However, it should be noted that, in both 1890 and 1910, the variable for share of blacks who were registered to vote was insignificant despite being in the expected direction (t-statistics of 1.09 and 0.33, respectively). Either way, Margo’s findings are similar to Kousser’s, and do not suggest that racism played a major role.
Whether the disparities in funding caused a decline in the black-white income ratio is more difficult to say. The majority of the benefit from education comes from being able to signal underlying traits like conscientiousness and intelligence (Caplan, 2018), and therefore the absolute amount of education does not matter, but rather one’s relative ranking, as can be seen from the fact that national-level education reform does not benefit those affected by it (Clark & Cummins, 2020; Clark, 2023). However, because the purpose of signaling is to be able to make yourself stand out from the average, the inability to signal would only reduce the variance for blacks, and not the mean income. In other words, reducing blacks’ ability to signal would make it harder to distinguish between inferior and superior members of the black population, and, theoretically, would lead to a compression in wages toward the average, but not to a shift of the average itself. This is only true, of course, if employers compared potential workers of a given race to others of the same race, when it came to estimating the value of their education. As years of education was less associated with income in the black population than among whites (see below in Part IV and Appendix A), this seems to have been the case, and, regardless, would be predicted from the basis of markets’ rationality.
Furthermore, the U-shaped pattern of school quality in the South suggests that, if lower funding of black education relative to white education was a major contributor to the income gap, it would be expected that trends in income followed this trend, too. However, data reported in Part I show that the Southern income gap was already large in 1880, at which time educational disparities in education quality appear to have been small, and this gap only widened moderately between that year and 1940 (from 47% to 58.3%), during which time the difference in quality increased sharply. Furthermore, when the quality disparity decreased over the next few decades, at which point it no longer existed, the Southern gap decreased only slightly (in 1960, it was 53.1%). Looking at occupational data, there was almost no improvement in the South between 1910 and 1950, despite massive decreases in educational inequality. Overall, the data do suggest a slight correlation between educational funding and economic outcomes, but the link is tenuous, and certainly cannot be regarded as proven.
Redlining
In the 1930s, the Home Owners’ Loan Corporation (HOLC), an agency created under FDR, created color-coded maps of major cities, with areas colored red designated as the riskiest. These maps, according to some researchers, can be used to explain anything. In terms of their effect on people living today, it has been claimed that they:
gave black adults asthma (Schuyler & Wenzel, 2022);
made black people fatter (Owens et al., 2024);
made minority neighborhoods smell worse (deSouzza et al., 2025);
blinded residents of poorly rated neighborhoods (Hicks et al., 2023);
Decreased participation in birdwatching (Ellis-Soto et al., 2023); and
prevented nonwhites from adopting pets (Blackwell et al., 2024, p. 52)
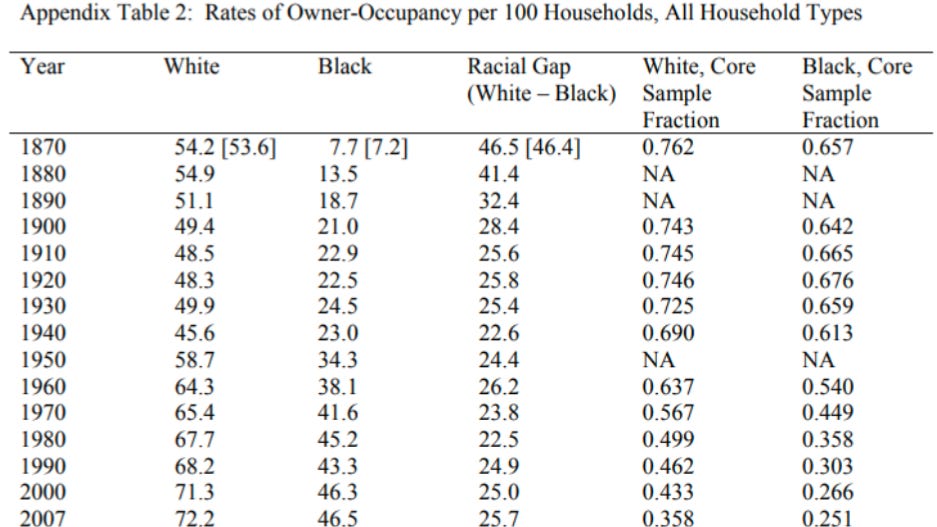
However, these maps appear to have been little distributed and to have had, in general, little impact on lending practices (Fishback et al., 2024; Hillier, 2003a, 2003b, 2003c; Malach, 2024). Indeed, data from loans made in Philadelphia has shown that blacks were no less likely to receive loans in the 1930s than whites (Hillier, 2003c). The essential non-existence of red-lining can be seen also from the historical trends in homeownership by race, as presented by William Collins and Robert Margo (2011). Redlining is thought to have occurred between the drawing of the maps in the mid-1930s and the fair housing act of 1968. As can be seen from the table, however, there was no appreciable change in the black-white difference in home ownership during this time. Redlining appears to have either not occured, or to have had only a marginal effect.
Slavery
The first consideration is whether slavery was, in fact, caused by racism. While the answer may seem obvious, that reaction is not justified. Every country on earth has, at some point, kept slaves, and the reason cannot have always been racism. Indeed, America was a slave society since the first colonies were founded by the English, with the majority of the slaves being white until the early 18th century. It is true that these white slaves were, in fact, not permanently enslaved, and in some cases came willingly to America, but extensive studies of indentured servants have found that they were not treated any better, and that they often died before their terms expired. Don Jordan and Michael Walsh (2007) did not shy away from referring to them as slaves, titling their book, White Cargo: The Forgotten History of Britain’s White Slaves in America. They write: “The lengths through which some previous writers on this subject have gone to separate out servitude from slavery seems to us to miss the point that there were, and are, different types of slavery” (p. 186). Other books which expressly refer to indentured servitude as slavery include They Were White and They Were Slaves: The Untold History of the Enslavement of Whites in Early America (1993), and The Irish Slaves: Slavery, indenture and Contract labor Among Irish Immigrants (2010).
Furthermore, the first African slaves to come to America were also indentured servants, as they were not permanently in bondage, nor does it appear that their status passed down to their children; it was not until the 1660s, by which point Africans had been in North America for about forty years, that any of them were permanently enslaved (Higginbotham, 1978; Morgan, 2001, pp. 34-35). The decline of white indentured servitude and increase in black permanent slavery can be explained perfectly well by the economic evidence (Galenson, 1984)—simply, whites became indentured servants in order to pay for their transportation to America; when this became cheaper, they no longer needed to sell themselves, and therefore stopped doing so. It was not necessarily race that eventually made black slavery so common, but perhaps because their supply better matched demand.
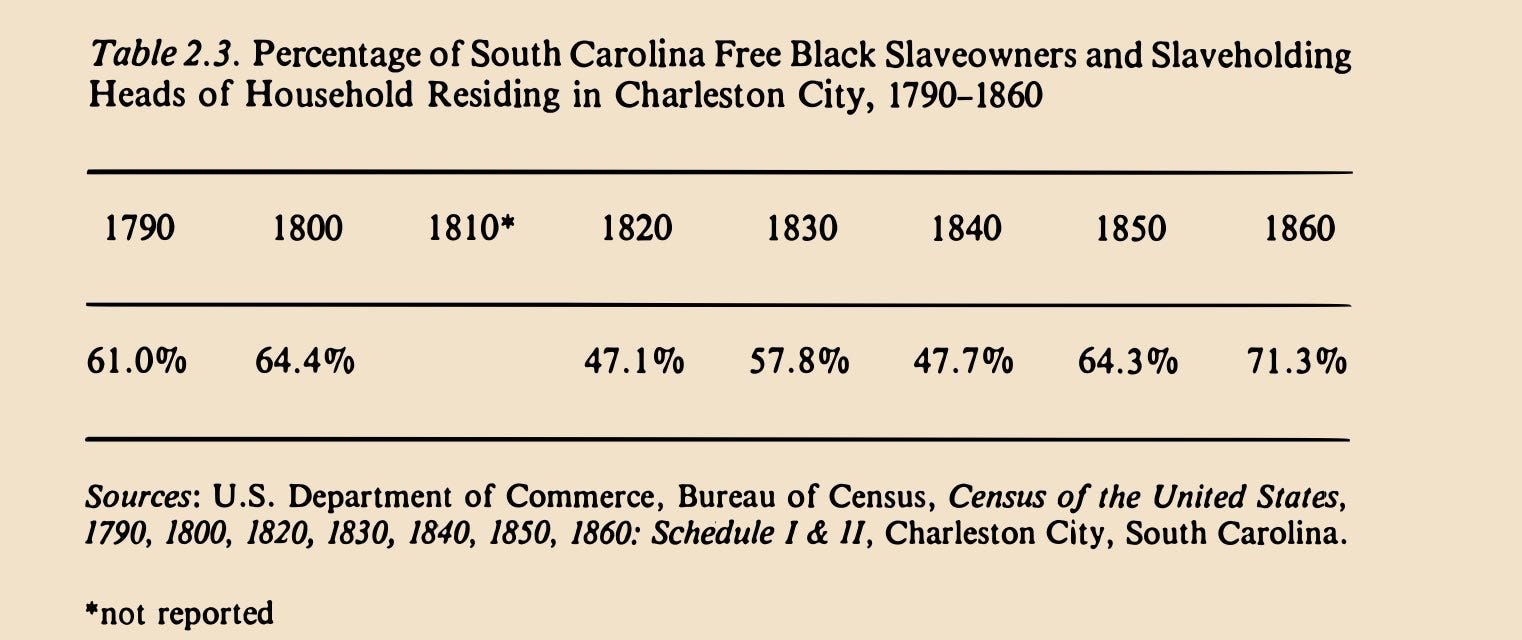
Also note that ownership of black slaves was not only done by whites. Indeed, the current best estimate for 1830 can be plausibly interpreted as showing a similar propensity for owning slaves for blacks and whites—Southern white households were perhaps three times as likely to own slaves as Southern free black households, but this difference may be largely explained by differences in wealth and in an undercount of black slaveowners (Lightner & Ragen, 2005). In Charleston, South Carolina, for which the data are exceptionally abundant, between half and two thirds of free black households owned slaves, depending on the year (Koger, 1985; see image below). Although it has been argued that black slave owners were typically “benevolent,” simply buying family or friends in order to save them from other slave owners, there is a lot of impressionistic and empirical research which disproves that hypothesis, and the theory is met with incredulity from more recent historians (see Koger, 2006; Graber, 2022, ch. 7).
Another important fact to mention is that not very many slaves were imported into the U.S. during its history—just some 500,000, representing about 4% of the total African slave traffic to the Americas during the transatlantic trade (Curtin, 1969, Table 24; Eltis, 2008). Almost all of the growth in the number of slaves occurred through natural reproduction (Hacker, 2020). Because Africa at the time still had a form of slavery in which the status was both permanent and transferable to one’s children, it makes sense that Africans were the first group to be enslaved in such a manner in the U.S., after which it was inevitable that they would become the dominant group of bondmen through reproduction.
The second question is whether slavery had a large effect on blacks’ incomes relative to whites’. The effect of slavery on wealth was obviously large, as shown by the rapid accumulation of wealth by blacks after slavery ended, though this did not last long, especially when migration to the North is not a confounder (Derenoncourt et al., 2022; Higgs, 1984; Margo, 1984a; see also the homeownership data above). However, because I am calculating the effect of discrimination on income specifically, this is not, strictly speaking, relevant. When looking at income, there seems to have been almost no growth between 1860 and 1900, if in-kind payments to slaves are counted as wages (O’Brien, 2000). Furthermore, blacks who themselves were born as slaves were only very slightly lower on average in occupational status in 1880 after controlling for region (Sacerdote, 2005).
It is also important to understand that, if slavery had a negative impact on white income, it’s possible that it actually increased the black-white income ratio. The negative impact of slavery on economic growth has, in recent decades, been argued by many competent authors (e.g., Wright, 1986, 2022), although, even if this is taken to be generally true, it is not evident that the negative impact was larger for white labor than black labor.
Overall, slavery seems to fail on both counts. It is not, I think, possible to say for certain that it was primarily motivated by prejudice, and the available evidence shows that it probably had little to no effect on blacks’ incomes.
Part IV: Individual Discrimination
Unlike in Part III, the focus of each section will be on a specific type of labor at a certain time. Often, only one or two studies will be available for consideration.
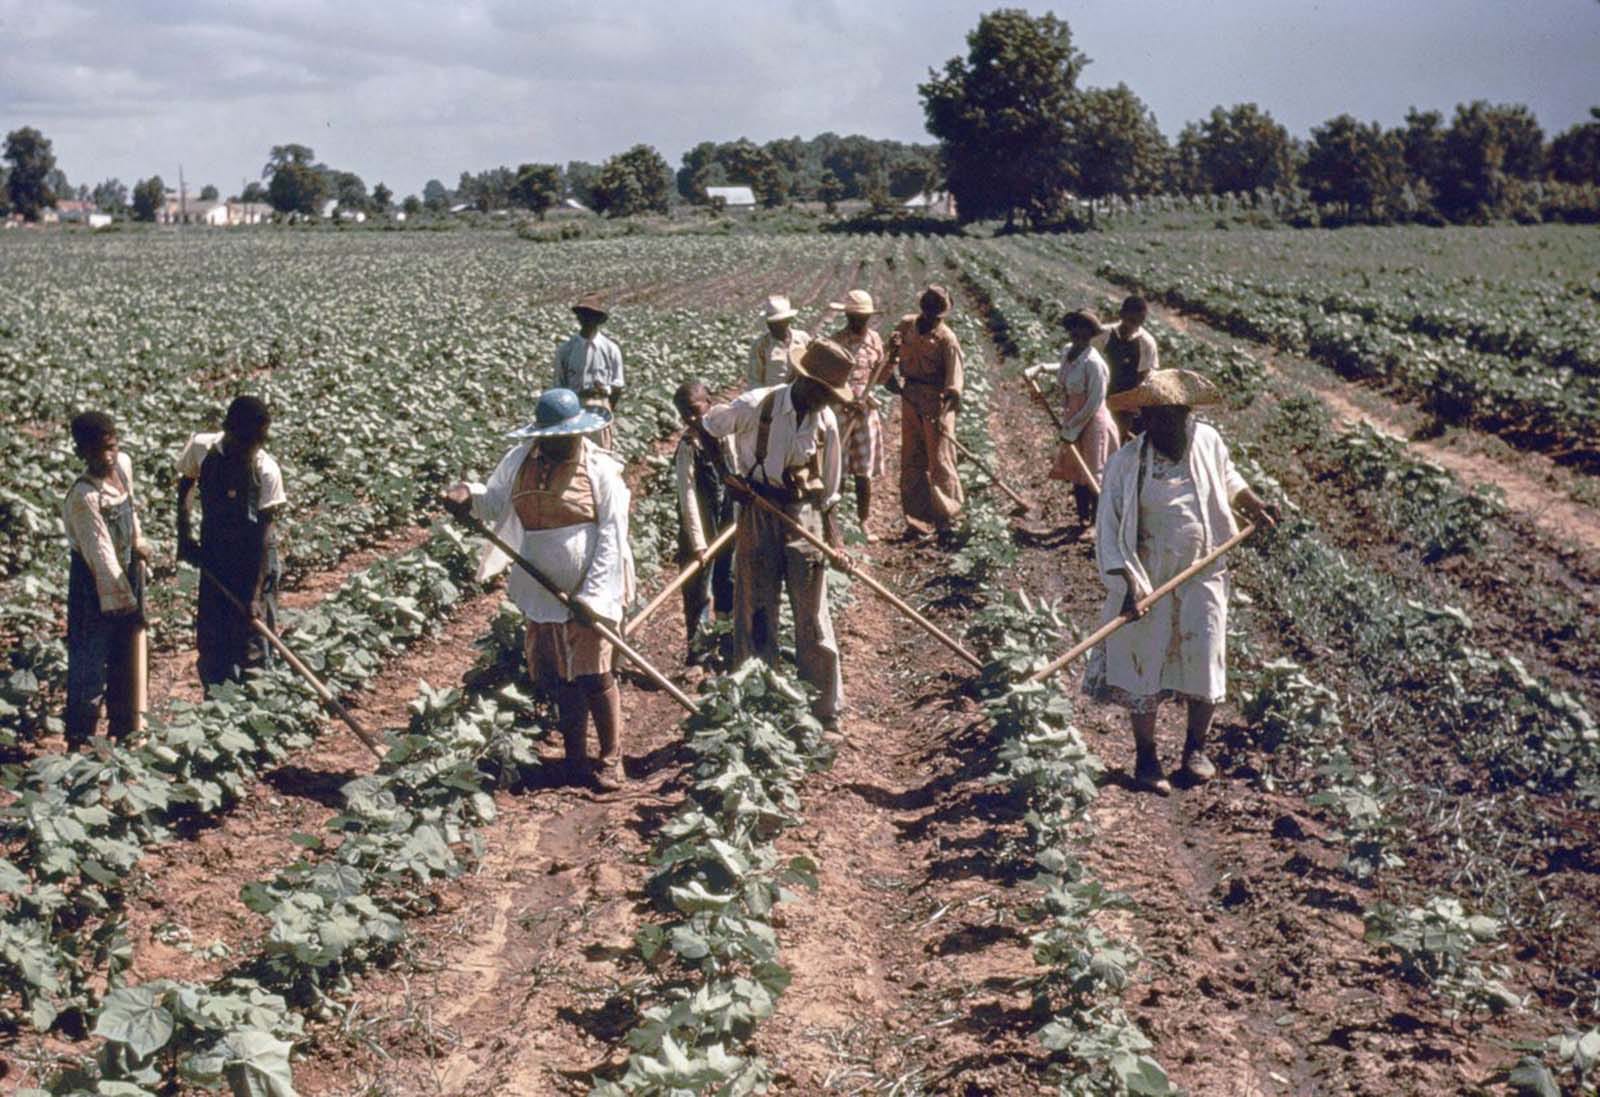
Southern Agricultural Workers, 1880-1910s
Robert Higgs (1978) drew attention to a little known agricultural survey conducted in 1887 by the state of North Carolina. Included in this report were statistics regarding the responses to this question: “Any difference [in average wages paid] to white and colored [laborers]?” (p. 310, brackets higgs’). In each county, one landowner and one laborer or tenant was interviewed, for a total of 95 responses for each type of respondent. Of the landlords, 94 (98.9%) said that blacks got the same wages as whites, while only one said that they did not. The tenants and laborers were less unanimous, but most (77, or 81.1%) still believed that there was no racial difference in wages.
In an earlier paper, Higgs (1972) examined data collected by the U.S. Department of Agriculture during the last two years of the 1800s.
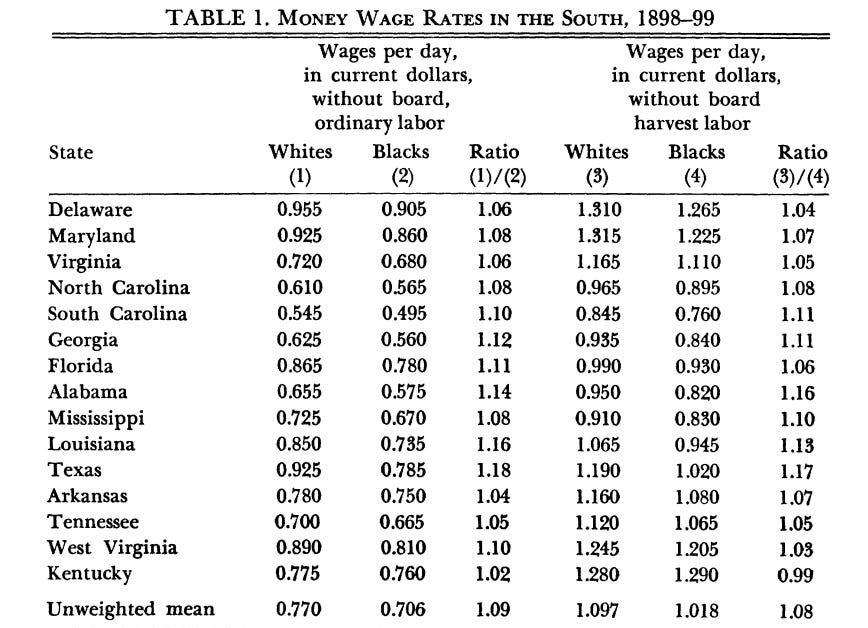
Without taking into account board, and by using an unweighted mean of the state’s average wages for blacks and whites, Higgs found that blacks’ wages were just 9% lower than whites’ wages during the normal season, and 8% lower during the harvest season. He hypothesized that, if room and board were taken into account, the wage difference would become smaller still, or perhaps even disappear entirely, as the author of the report from which he got his data noted his impression that blacks tended to get more in kind benefits (see p. 327).
Higgs’ analyses are confirmed by Kenneth Ng and Nancy Virts (1993), who estimate that the black-white per capita Southern rural labor income—that is, farmers’ income obtained by selling their labor–ratio was 0.89 in 1880, when only those above the age of fifteen were included in the population estimates (“Average Worker Income” rather than “Per Capita Income”). Although Ng & Virts’ estimate various different income ratios, this is the most important one, as it adjusts for geographic location, and also excludes income from sources that cannot possibly be mediated by discrimination (e.g., returns on stocks).
These small to perhaps nonexistent wage differences can be complemented by Stephen DeCanio’s (1974) extensive study of black and white productivity differences among Southern farmers in the late 19th to early 20th century. He began by examining contemporary literature, finding mixed opinions; while many believed that blacks made for less productive laborers, a seemingly equally large number believed that they were equal or superior to white agricultural workers (pp. 76-91). Next, DeCanio analyzed census data from several decades (see, generally, chs. 4 & 5) finding that, at the county level, there did not seem to be a consistent pattern between racial composition and productivity, as the relative merits of the two races of workers differed between regions (“cotton belt” vs. “periphery”) and by type of farming (“cotton” vs. “non cotton”). For the South as a whole, for the years 1880 to 1910, he found that, after controlling for numerous variables that differ between counties, white cotton farmers were most productive, followed by black cotton farmers; these were, in turn, followed by black non cotton farmers, who were approximately equally productive as white non cotton farmers (e.g., p. 215). The overall difference favored whites somewhat, but Decanio argued that this can largely be explained by factors like whites tending to, on average, have better land within a given county (see ch. 6).
When it comes to farming, intelligence is a fairly weak predictor of income, and may even be completely uncorrelated (Perry & Schreiner, 1990). Furthermore, tools used for farming in the South at the time were primitive, even by that time’s standards (Fergeler, 1998), which likely made intelligence even less important; indeed, it has been found that education (a proxy for IQ) is much less correlated with farmer productivity in samples from underdeveloped locations (Lockheed et al., 1980). Therefore, it is not completely implausible that blacks were similarly productive as whites.
Data on farm operators in general is provided by Gavin Wright (1986). His figures, based on data from 1900, suggest that there was a large disparity in the South Atlantic region, but much less difference in the South Central states (Figures 4.5-6). The issue with such comparisons is that the term “farm operator” can refer to several very different types of labor: owners, overseers, and either cash or share tenants. Wright’s analysis (pictured below) shows that blacks were much less likely to be owners or managers, and more likely to be tenants who, of course, were paid less.

When whites and blacks worked as simple agricultural laborers in the late 19th century South, they tended to receive the same wages. This is plausible, given that their productivity appeared to be similar, perhaps with a slight white advantage. These data, then, are not consistent with the discrimination hypothesis. This is confirmed by a contemporary survey, most of whose respondents indicated that there was no differentiation in wages between blacks and whites in North Carolina.
What about sharecroppers? Lee Alston and Kyle Kauffman (2011) analyzed data from a 1911 survey of 39 Georgian plantations. Of the total sample of sharecroppers on these plantations (most workers on these plantations were not sharecroppers), 325 were black and 48 were white. Alston & Kauffman reported findings for two samples: the full sample, including all 39 plantations, and a sample of just plantations which had both black and white sharecroppers (total n=168). In both samples, it was found that blacks and whites made almost the same incomes, with massive overlap in their confidence intervals.
The authors concluded with the following:
[W]e found that black and white sharecroppers received equal incomes. This result … indicates the prevalence of competitive markets for labor on the lower rungs of the agricultural ladder. (p. 192)
Virginia, 1900-1926
Higgs (1977b) analyzed wage data from about 500 labor contracts in 1900 and 1,500 in 1909, from Virginian firms. In total, over 19,000 workers were included in these contracts. These were his results when he limited the sample to firms whose workforces were racially integrated (p. 240):
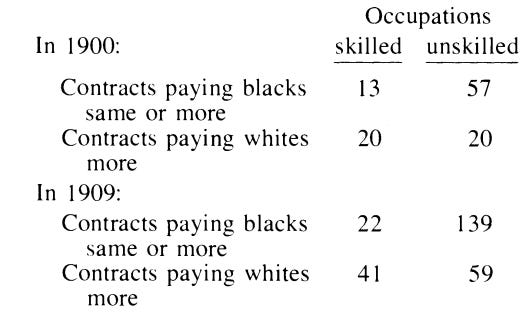
In all, most firms paid blacks and whites the same wages when the position was unskilled (74% of the time in 1900, and 70% of the time in 1909), while blacks were typically paid less in skilled positions (61% of the time in 1900, and 63% of the time in 1909). These data are not consistent with the discrimination hypothesis for two reasons: 1) as the position becomes more skilled, qualified blacks become less replaceable, leading to higher costs of discrimination, which must reduce the amount of discrimination that actually takes place (Becker, 1957, pp. 52-53), and 2) because discrimination can only occur, in this case, when a superior black is paid less than an inferior white, and superior black workers must have been more common within the less skilled occupations. In other words, it would be expected that discrimination would happen more often in the unskilled occupations because there would be more opportunities to discriminate, and because the cost of doing so would be lower; that this is not shown in the data is evidence that such differences in wages were not caused by discrimination.
Warren Whatley and Gavin Wright (1994) present data from the Bureau of Labor for the state of Virginia, for the years 1908, 1909, and 1926. A major advantage of these data is that they show results for all workers, and not just for those who are in integrated firms. For the 1908 data, the authors remark that:
The white distribution is bimodal, the black distribution unimodal; but the peak for the black distribution is at virtually the same wage level as the left-handed peak for the white distribution. If we interpret the first peak as the ‘unskilled’ market and the second peak as the ‘skilled’ market, then we may say that despite the prevalence of racial segregation, unskilled wages were effectively not differentiated by race. Apparent racial differences were, in reality, skill differentials [ending the quote here is misleading, but the rest of what they write here is not important for this essay; see Appendix B]. (p. 276)
Indeed, when looking at wages for 1909, it can be seen that there is virtually no difference between blacks' and whites’ wages in unskilled occupations.

Similar results, however, were not found in data for 1926:
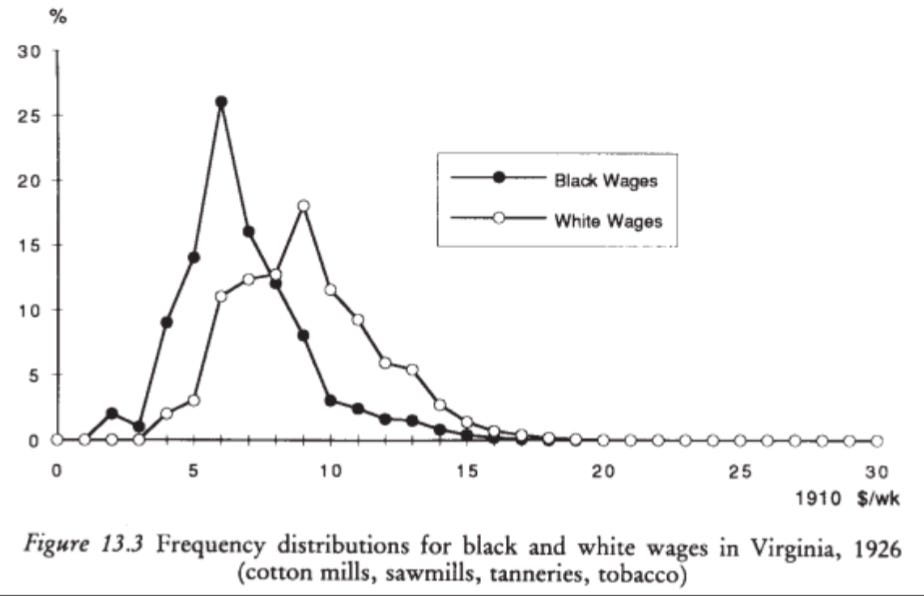
The difference in 1926 is very large. Although the authors do not report the exact averages, it can be seen from the graph that white unskilled workers probably had wages at least 50% higher. Whatley & Wright explain the change between these two dates as follows:
When we try to identify the reasons for this divergence, many proximate factors can be listed: the stagnant world market for cotton during the 1920s had a disproportionate effect on blacks, as did the depressed conditions in lumber and saw milling; real wages in cotton textiles, on the other hand, rose to a relatively high plateau during the wartime boom, and proved resistant to downward adjustment for a number of reasons. (p. 277)
This pattern, of course, does not fit with any hypothesis involving racial discrimination, as it is very unlikely that white attitudes toward blacks became less favorable during this time.1
Public School Teachers, 1890-1950
In his Race and Schooling in the South, 1880-1950 (1990), Robert Margo reported the following data for teachers’ black-white wage differences in the South:
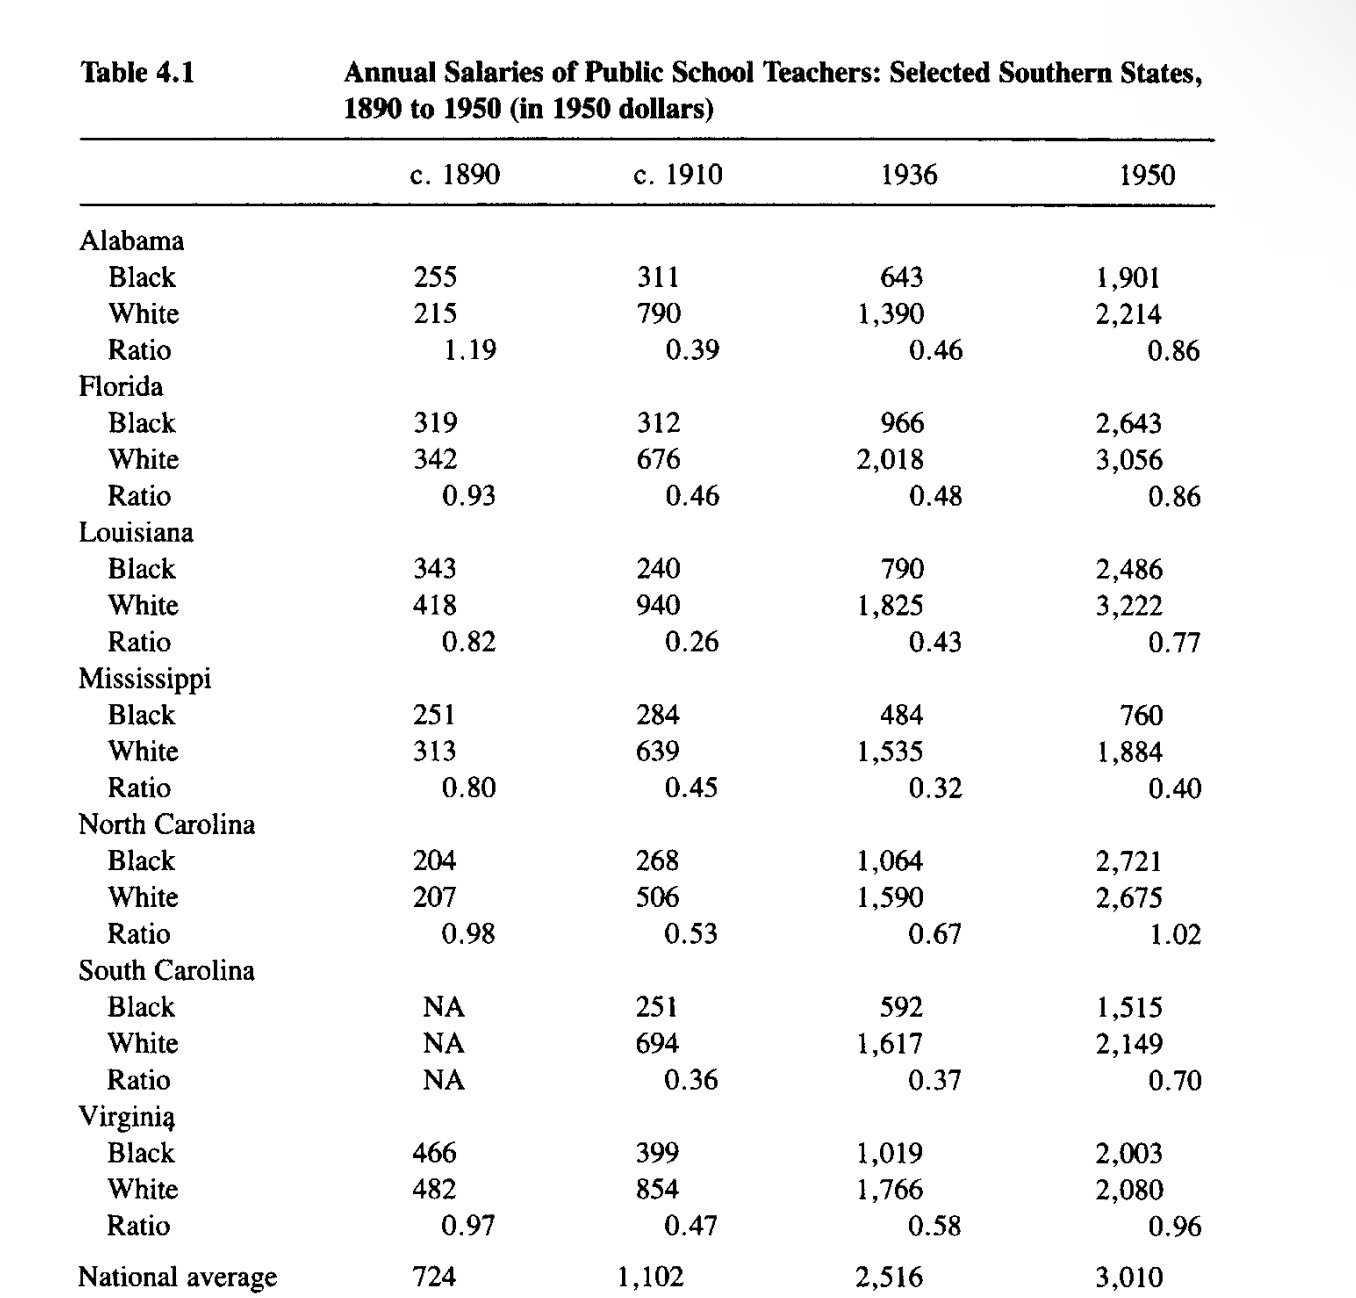
As with black-white ratios in per pupil education spending (see the section on education in Part III), the pattern is U-shaped. In 1890, it appears that there was very little difference in pay, but in 1910 and 1936 black teachers only made about half of what white teachers made. However, by 1950, the difference in pay was small (less than 15%) in five of seven states, and only very large in Mississippi. That this pattern is consistent with the trend in per pupil education spending suggests that part of the difference can be explained by the amount of funding received by the district at which the teacher works.
In an earlier paper, Margo (1984b) used data from Florida (in 1910), North Carolina (also in 1910), and Louisiana (in 1913) to see how much of the wage differences from that period could be explained by Census-measured variables at the county level, as well as a few measures from government reports on education. One of the variables obtained from government reports was the portion of teachers who received a first-grade teaching certificate. Teaching certificates were given to those who passed examinations, with the first-grade certificate being the best one, indicating a high score on the test. Margo’s results show that, after controlling for all of these variables, only approximately 10-20% of the difference in wages could be adjusted for, depending on the state (Table 6). His paper provides enough information to estimate what the difference in black and white wages would be if they did not differ in these variables.2 These ratios are 0.57 for Florida, 0.42 for Louisiana, and 0.65 for North Carolina. Margo (1990, pp. 56-64) also investigated what explains the black-white gap in teacher salary using data from 1940. In this case, the types of data were more limited, and he could only control for age and years of schooling, though with the advantage of the measures being at the individual level. He found that these two variables could account for just 13.9% of the difference, leaving a black-white ratio of 0.54.3
Both of these studies by Margo provide evidence for discrimination. However, such a conclusion is not necessarily warranted. In the first study, the most important variable was the portion of teachers in the county receiving first-grade certificates (indeed, Margo, 1990, ch. 4, reanalyzed the same data only using this variable, getting almost the exact same results), but it is unknown how well these measured teaching ability. Furthermore, matching blacks and whites for years of schooling certainly did not match them for the skills associated with education, as many studies from the early and mid twentieth century show that the difference between whites and blacks enrolled in high school or college in intelligence is not any smaller than it is in the general population (approximately one standard deviation; see Shuey, 1966, ch. 4 for a meta-analysis). Margo’s later study was weaker still, as it only regressed for years of education and age.
Bradley and Mary Hansen (2006) used individual level and county level data from Virginia for two school years, 1905-06 and 1906-07, mostly for the purpose of seeing if there were differing returns on education and education certificates. They found some differences, though, in my opinion, they are overstated. Here is their main table:

Aside from special certificates, which were held by relatively few teachers (just under 4.2%, according to their Table 1), and emergency certificates, which were also not very common (14.8%) and did not attain significance at even the p<0.1 threshold for either race after controlling for the average age of teachers in the county, certificates tended to be similarly lucrative for both races. This makes sense, as they were objective measures of ability—however well they measured it. On the other hand, schooling had much lower returns for blacks than it did for whites, as would be expected from the fact that black college and high school students were much less intelligent than similarly educated whites. The lower return for education has been found at the national level, too (see below in Appendix A), and should not be taken as a sign of discrimination. As mentioned above, discrimination should actually decrease with education, as more skilled blacks are more costly to discriminate against.
One way to explain differences in wages is the number of days that blacks attend schools, which had the same U-shaped pattern as wages and funding. According to Margo (1990, Table 2.6), the black-white ratio in the number of days in the school year was about 1 in both 1890 and 1950. However, in the intervening years, it was lower. In 1910, the ratios ranged from 0.49 (Louisiana) to 0.91 (Mississippi). In 1935, the ratio ranged from 0.73 to 1.0. If the ratio is weighted for the number of days (but not the number of students, as that is not reported in the table), the average becomes 0.76 in 1910 and 0.87 in 1935. This information can be used in conjunction with Margo's estimated wage differences that were unexplained by the observed variables to get a daily wage ratio. The Floridian black-white ratio in school year length was 0.81 in 1910; dividing the previous estimate (0.57) by this number gives a daily wage ratio of 0.70 for Florida. Completing the same process with the other two states gives the results of 0.86 for Louisiana and 0.72 for North Carolina. Taking the weighted average of 0.87 as a divisor for the ratio for 1940 (0.54) gives the quotient of 0.62. This is likely lower than the estimates for the individual states’ ratios because certificates were not included in the regression, and also perhaps because the divisor was weighted only by the number of days per state, which does not account for differing populations (the appropriate weighting would be student-days per year, or, in other words, the number of students in the state multiplied by the same state’s average number of school days in a year).
Probably the best estimate of the black-white ratio after accounting for known influences, then, is between 0.7 and 0.8, leaving the rest to be accounted for by discrimination, as well as human capital which could not be observed (e.g., warmth toward children). Although this gap is not proof of racial discrimination in of itself, it would not be surprising if such racial discrimination did occur for teachers. This is because the teachers included in these studies were public school teachers, meaning that the government had a monopoly on the hiring process (this point was made by Margo, 1984b, p. 318). Because monopolies (especially government ones) do not need to worry about efficiency, the economic downside to discrimination is lower (this was discussed at length by Becker; see Appendix A). When interpreting these data, it is important to stress that there was no difference in 1890, and a smaller difference in 1950 than in the years spoken of here. The smaller differential in 1950 could fit into the discrimination hypothesis, as racial prejudice did decline in the few decades preceding that year (see above), but the fact that there was no difference in wages in 1890 would be more difficult to explain, as there is no reason to believe that racism increased to such a high extent after 1890, and so much so that prejudice was greater in 1950 than six decades earlier!
Ford Autoworkers, 1918-1947
Cristopher Foote et al. (2003) used data from the historical records kept by Ford on over 4,000 workers between 1918 and 1947, including only those who began working in 1918 or later and were no longer working by the end of 1947. From these records, they got information on the characteristics (e.g., education) as well as the wages of both whites and blacks. Included were data on how long they maintained their jobs, too. These researchers found that, while blacks and whites got approximately the same wages after several other variables were controlled (Table 4; depending on the regression method used, the black variable was either slightly negative or slightly positive), they were much more likely to be employed in the foundry, where labor was more dangerous and dirtier. Because, under standard economic theory, such labor would have a premium over cleaner, less hazardous labor (e.g., Friedman, 1962, p. 162), this could be taken as evidence that economic discrimination was practiced by Ford, but in the form of non-monetary value. Indeed, the disparity in the proportion of blacks and whites employed in the foundry is stark—41% and 5% of workers, respectively (Table 3). Foote et al. estimate that those working in the foundry earned between .5 and 2.5% more, depending on which regression model one uses. The average of the three models for which results were presented is 1.23%.
If blacks made up most of the foundry workers, and their wages were supposed to represent what their wages would be had they not been employed in the foundry (as contended by these researchers), then this estimate will be biased downward. Unfortunately, Foote et al. do not provide an estimate of the premium paid to white foundry workers specifically, but a simple equation can be used to estimate that, if 0.0123 is taken to be the observed premium, the true premium must have been about 3.75%.4 Because 41% of blacks were employed at the foundry, and because the average wages of both races were the same, the average African American worker at ford would have received 1.54% (41% of 3.75%) higher wages than the average white worker if the foundry premium were applied to each race equally. It appears, then, that whatever disparity did exist was very small, if translated into its monetary equivalent.
The small difference that did exist could perhaps be partially explained by a greater tolerance of heat by blacks (see Foote et al., 2003, pp. 529-530), and, indeed, a 1943 survey of New Orleans employers who hired both blacks and whites found that, if those with no opinion were excluded, 52.6% believed that blacks were better able to tolerate heat, while only 5.1% thought that whites had a better capacity for the same (the rest did not believe there was a significant difference between the races in this regard; Wilson & Gilmore, 1943, Table 3). If true, this fact would somewhat reduce the premium, but would certainly not eradicate it. Perhaps more important were characteristics like intelligence, which will have been only weakly accounted for through variables such as education. No matter how one analyzes the data, however, it is clear that discrimination could not have played much of a role, contributing to, at most, the equivalent of a 1.54% wage differential.
Manufacturing Workers, 1936-1960s
Higgs (1989) analyzed data from 1936 and 1937 regarding wages paid to whites and blacks working at factories which hired members of both races. In each year, there were roughly 900 factories surveyed from the North and 500 from the South. His results looked as follows:
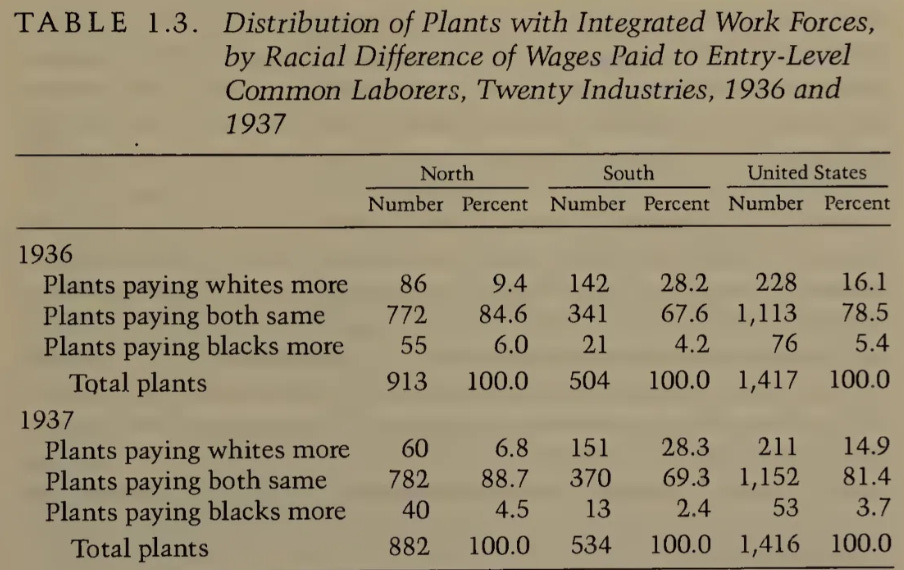
Combining data from both years, it can be seen that in the North 8.13% of factories paid whites more, while 5.29% paid blacks more. This implies that the amount of discrimination could not have possibly been very high as it pertains to wages. On the other hand, Southern plants paid whites more in 28.23% of cases, while they only paid blacks more in 3.28% of cases. Although this itself does not prove that discrimination reduced blacks’ wages, it is much more likely to have been a significant factor there than in the North.
A much clearer conclusion can be drawn from data reported by Leonard (1984), collected by the Equal Employment Opportunity Commission, based on over 12.5 million manufacturing workers in 1966. Though this was not the main purpose of his study, he does state that the average non-white worker was “.68 times as productive as their white counterparts,” and, meanwhile, “the earnings ratio of black to white males” was 0.69 (p. 162), indicating that their difference in pay was almost perfectly correspondent to their difference in productivity (if anything, they were paid more than they should have been). It should be noted that in the case of national surveys such as this where productivity is known, it is not necessary to adjust for geography. This is because geographic location is only an indicator of income insofar as it is an indicator of productivity; at a given level of productivity, workers should be paid the same amount irrespective of their location (Clark, 2007, pp. 336-351).
The Entire American Economy, Late 1930s
The earliest national survey of wages in which race was a variable was conducted in 1937, with results reported by Whatley & Wright (1994):
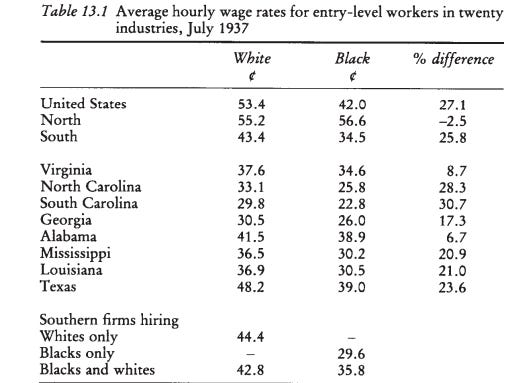
It can be seen that, at least among unskilled workers, there was little difference in wages in the North (indeed, blacks made more on average), whereas the difference was large in the South. Whatley & Wright warn that interpreting these results as indicating racial discrimination in the South would be unjustified, given that data for Virginia (see above) did not show a gap in black and white wages three decades before this survey. Instead, these data indicate that industries where blacks made up most of the labor force declined in importance in the South in the intervening years, whereas that was not the case in the North. A further study of incomes in 1939, whose design is able to account for confounders, is of interest when interpreting these results.
This study is Mill & Stein’s (2016) examination of Census income data for those who were mixed race. The researchers traced siblings who were recorded as being “mulattos” in the 1910 Census to the 1940 Census. This was done because the latter removed the category of mulatto, forcing census takers to record mixed race Americans’ race as being either white or black. Therefore, those mulattoes who could “pass” as white would be labeled as such in the Census, whereas those who could not were labeled as black. In some cases, one of the mulatto siblings was labeled as white in 1940, while the other was labeled as black. These are the cases which serve as the main sample used in this study, as any differences between them must almost necessarily be due to some form of discrimination (since they have the same parents, their genetic propensity toward any given thing should not be correlated with the lightness of their ability to pass as white, nor can the difference be due to how they were raised, as they grew up together). Here is Mill & Stein’s main table:
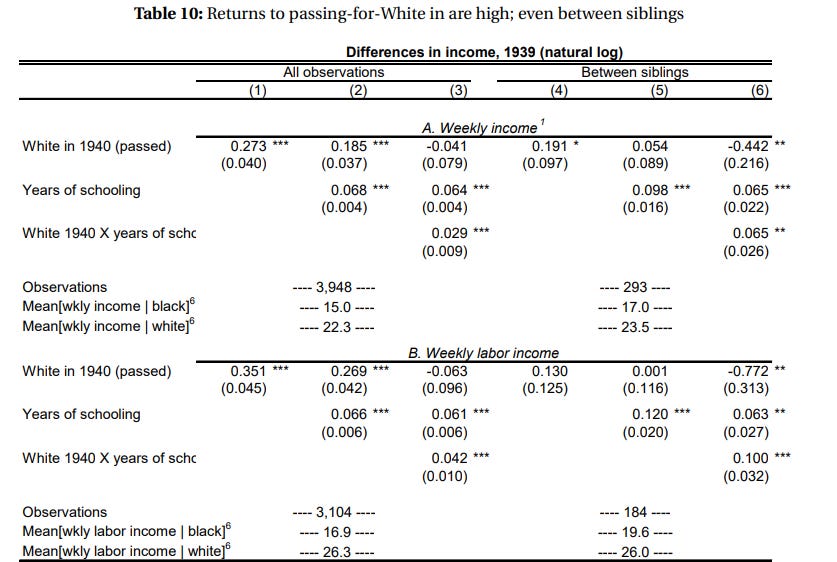
Note that a single asterisk means a p value under .1, two asterisks refers to a p value under .05, and three indicate a p value of under .01. When the general population is compared, the returns on weekly total income and weekly labor income are quite high: about a 31.4% increase in total income and a 42% increase in labor income. (Because these numbers are natural logs, these percentages can be calculated by setting e to the power of each corresponding coefficient, in these cases 0.273 and 0.351, respectively.) However, the increase is much smaller within sibling pairs, and further decreases with controls. Among siblings, when years of schooling are controlled for, the effect of passing as white becomes an income 5.5% higher. Once an interaction between passing as white and schooling is added, the passing white coefficient flips signs and now becomes by far the largest coefficient, indicating, roughly, that white passing mulattos earned 34.4% less total income and 53.8% less labor income. Obviously, it is impossible that being white could have been this much of a disadvantage, and it is difficult to interpret why the addition of that interaction had such a large impact on whites. As with the other results in the table, the p values are not very impressive—just p<.05 on a massive effect size. Probably the simplest interpretation of this study is that being seen as white was, at most, a very minor advantage. The effect size for passing as white on labor income was 0.13, equivalent to an increase in wages of about 13.9%, and is not significant at even the .1 level. The effect size for total income was larger (21% increase), and did attain statistical significance at the .1 level. However, as mentioned before, labor income is much more relevant than total income, as the latter includes things which racism cannot possibly affect. Controlling for education, as is done in the fifth column, is not appropriate, as any differences in education should have arisen through racial discrimination. Therefore, the best estimate from this study is that black income would be approximately 14% higher if they were indistinguishable from whites, but this should be given no weight, as a result of this magnitude would be expected to occur more than 10% of the time if the true effect were null.
Furthermore, if the 14% figure were to be believed (which I do not recommend), it is noteworthy that it goes down to approximately zero (.1%, p > 0.1) after education is controlled for; this indicates that the way in which passing as white increases income is through getting more education, which, in turn, also means that costs such as tuition and years of lost labor will be incurred, therefore decreasing the aggregate effect of being white. On top of this, any white passing siblings who did not share both parents with their non-passing sibling will have caused an overestimation of this increase. This is because those who share only one parent with their sibling will likely have more white admixture if they pass than if they don’t (siblings who have no parents in common would be a greater problem still, but this was probably not a major issue; for the problem of identifying if the siblings share biological parents, see Mill & Stein, 2016, pp. 29-32). Although the study was designed well, it lacked statistical power, making its results harder to interpret. Still, they do not inspire much confidence in the view that discrimination was the main reason for black-white wage differences, as, if the approximately 14% increase is taken for granted (and it shouldn’t be), that would explain only about half of the difference found for the whole United States in 1937 (27.1%).
Part V: Conclusion
In various occupations, at various times and places, it was demonstrated that there was little to no race-based discrimination—either because there was no black-white wage difference in the first place, or because adjusting for relevant factors decreased it to insignificance. In other cases, the evidence was equivocal, but there was never any evidence which seemed to me definitive in its support for the discrimination hypothesis. The sum of the evidence is strongly to the disfavor of a large overall effect of discrimination, especially when considering the fact that there has not been any major improvement in black income over the last 80 years, during which time prejudice has declined into obscurity.
Many of the authors whose research I have cited maintained that racial discrimination was the largest factor in determining black and white income differentials in the 19th and 20th centuries. Some notable exceptions are Robert Higgs, Gavin Wright (see Appendix B), and Stephen DeCanio (see Appendix C), whose views were more complicated, but mostly leaned toward discrimination playing a smaller role than rational market forces. How is it possible for me to conclude that racial discrimination was a very small factor in the relative ratio of white and black incomes, despite relying primarily on the work of those who strongly disagree with that view? Partially, the answer lies in historians’ massive liberal bias, which was especially in the case in the 1970s, when left-wing radicals largely took over the field (see Graber, 2019). Many authored simply analyzed their data incorrectly: Mill & Stein (2016) took at face value an effect size whose p value was above .1, Foote et al. (2003) did not consider that the foundry premium, if applied equally to whites and blacks, would only raise black wages by 1.54%, and Margo (1984b, 1990) did not adjust his black-white teacher wage ratios by the number of days they taught per year. The fact that such mistakes seemed to have always erred toward the discrimination hypothesis, and were made by researchers whose analyses were otherwise very intricate, suggests that liberal bias played a large role in forming their conclusions.
Appendices
Appendix A: Becker’s Analyses
Throughout this post, I have cited Gary Becker’s The Economics of Discrimination (1957), but have not yet discussed the several empirical tests which Becker employed. Some of the statements I make during this part of the post are not found in Becker’s work, but I do not typically mention places where our conclusions of his results disagree, as it would unnecessarily sabotage any attempt at succinctness.
Terminology
Throughout his analyses, Becker uses the terms discrimination coefficient, DC, and market discrimination coefficient, MDC. DC refers to the amount of money which an individual is willing to either pay or forgo receiving in order to act on his preference for one race over another. The MDC, on the other hand, is the amount of income lost by the average member of a given group due to discrimination; more formally, it can be expressed as being equal to the difference between the actual ratio of wages for whites and blacks compared to what their wages would be absent any discrimination (see Becker, 1957, p. 9, fn. 6). As explained above, discrimination cannot possibly occur if there is no tradeoff between acting on one’s preferences and maximizing productivity.
Monopolies
Because monopolies are not burdened by competition, they are less incentivized to make the most economically efficient decisions. This means that they will lose less by acting on their preferences, and therefore economic discrimination will occur to a greater extent. Becker tested this theory by examining Census data from 1940, and seeing if, at a given type of occupation, blacks made up a higher portion of the workforce in the industries which were less monopolistic. Here are his results:
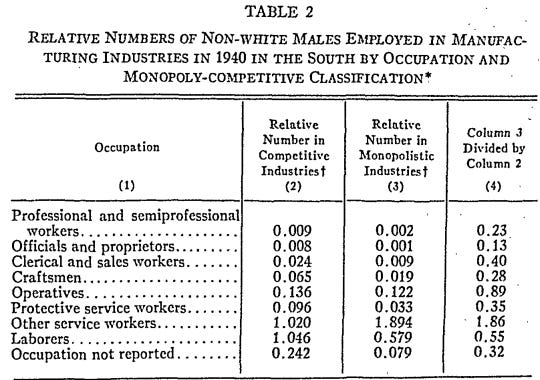
His finding is consistent with what would be expected, with monopolies having much lower rates of employment for blacks compared to whites in all categories but one (“Other service workers”). Although this does not directly answer the question of the extent of discrimination, it does put a logical limit on it, as discrimination would only be much greater in monopolized industries if the free market was able to stop a large amount of it from occurring in the first place. Note, of course, that this analysis used economic segregation as a measure, not wage differences.
Establishment Size
Because the non wage costs of employing blacks increases when more DCs are in play, these costs must be higher for employers in larger industries. For example, a business employing 500 people will have a higher cumulative DC from its employees against blacks than a business employing 100 people, which would increase the cost of hiring a black worker (most obviously, in terms of employees quitting). Becker tested this, and found that, in the South, there was a negative correlation between the size of certain businesses and the relative share of their workers which were black, although he notes that many of these differences were small and statistically insignificant (correlations ranging from -.64 to 0, with 5 being insignificant). The fact that this effect is not large also puts a limit on the size of the MDC, as the effect of adding individual DCs could not explain much of the difference in the proportion of those in an industry which were black. Becker also theorized that this could explain differences such as blacks being more likely to be employed in retail than in manufacturing, as retail businesses are typically much smaller. However, it could be argued that retail would be expected to have more discrimination against blacks, as in that industry they interact much more with consumers, who themselves also have a DC, and are much more numerous than coworkers and employers. As before, this analysis is more pertinent to the question of market segregation, and not directly to discrimination.
Length of Employment
Becker finds that the black-white income ratio is moderately higher in temporary employment than in year round employment, and that the proportion of black employees was greater in temporary employment as well. On the one hand, there would be more preference for discrimination when the employee is employed for longer, but the cost of this discrimination would be increased proportionately. Therefore the difference in relative wages should be a function of blacks’ greater productivity in these temporary positions, as the ratio between the appetite for discrimination and its costs are equivalent for the two types of employment. This evidence is indicative of only a most mundane conclusion, namely that not all of the difference between blacks and whites was caused by discrimination. It should be noted that the income ratios’ ratios were similar in both the North and South, though this also suggests little, other than that the maximum amount of the difference which could be explained by discrimination is the same (this would only matter if 100% of the black-white income differential at a given region were caused by discrimination when temporary and permanent employment are measured separately).
Age and Education
Next, Becker estimated how black and white wages differ by age and educational categories. Pretty consistently, it was found that the black-white wage ratio decreased as one looked at more educated people, and, likewise, fell as the ages examined increased. These effects were much stronger and more consistent in the South than in the rest of the country. Although Becker attributed the difference in a given age-education cell to be perfectly correspondent to the magnitude of the MDC against that group of blacks, this is not necessarily the case. The higher black-white difference at greater education levels can be taken as indicative of the greater difference in quality between blacks and whites at higher levels of education. This does not mean the differences in the quality of their schooling, but the difference in their own qualities. As shown above, colleges attended by blacks were not nearly as selective as those attended by whites. As for age, it is possible that blacks are more productive at jobs typically held by youths than at jobs held by those who are older; or, otherwise, they are less likely to be promoted than whites (perhaps for that same reason), and therefore have a lower age premium. A smaller factor, though perhaps still a significant one, is that blacks both mature and decay quicker (Rushton, 1995; Dutton, 2020), meaning that they were physiologically older than whites at the same ages in all categories. Because greater physical development is beneficial at younger ages, but becomes detrimental at older ones, this might partially explain the lesser differentials in youth than in middle-adulthood.

Relative Populations
Another hypothesis which Becker says was popular in the economics literature of the time was that discrimination against blacks is higher in areas in which they are more numerous, although it is not clear why this was thought to be true. Perhaps interaction with blacks would increase one’s preference for discrimination. On the other hand, having a taste for discrimination would become more costly because it would be applied to a greater number of instances. Becker finds that the correlation between the number of blacks in an area is .73, therefore being consistent with the hypothesis. However, after controlling for education and age differences between races in different areas, the correlation was reduced to .31, as the locations with a lot of blacks tend to be areas with larger differences in human capital between the races. Perhaps, the correlation would be smaller still if it were possible to control for more major human capital differences, such as intelligence.
Summary
Becker’s analyses, though interesting in of themselves, are not very useful for determining the extent of discrimination. Given that this was not the goal of his tests, this is not very surprising. However, what can be said is that his results are probably more consistent with the theory that discrimination had a small impact than the theory that it had a very large one, though only marginally so.
Appendix B: Wright’s Model
As stated above, occupational segregation does not necessarily mean that economic discrimination is occurring, as wages may not be affected. The economic historian Gavin Wright advanced a theory for how racial differences in wages emerged in the early 20th century South because of occupational segregation, without economic discrimination being present in his Old South, New South (1986), and developed it further in a later publication (Whatley & Wright, 1994). His model can be written as follows (Whatley & Wright, 1994, p. 274, eq. 13.2):
Where Aw is the average productivity of an all-white workforce in a given industry; A is the average productivity of a workforce whose racial composition is random; S is the productivity of an experienced worker, while U is the productivity of an inexperienced worker; P is the percentage of workers which are experienced; the subscripts w and b refer to whites and blacks respectively, with Fb being a variable for the percentage of the potential labor force which is black. In words, the equation can be expressed as this:
The productivity advantage of an all-white labor force over one whose racial makeup is the same as the potential workforce’s is equal to the difference in productivity between experienced and inexperienced worker, multiplied by the percentage of the potential labor force which is not white, multiplied by the difference in proportion experienced between whites and blacks in the potential labor force.
It is obvious from this equation that racial segregation is beneficial if one race has a significantly higher rate of having experience in that industry, and if there is a significant advantage (in terms of productivity) from experience. Of course, it should be kept in mind that this would only be true if more accurate indicators of experience than race were not available to employers, which may or may not have been the case. Wright contends that, in the early 20th century South, race differences in experience in various industries were large, and that productivity differences between experienced and inexperienced workers was high. He alleges that the differences in experience between races was caused by segregation of blacks and whites into different industries when it came to unskilled labor. While whites were employed at cotton mills, blacks were employed elsewhere–for example, in the tobacco industry. These unskilled occupations, in the early 20th century, received approximately equal wages, and therefore this did not result in economic discrimination (see Wright, 1986, pp. 181-95). However, over time, the arbitrary decision to employ blacks in different industries, despite not affecting the first generation of these black and white workers, ended up depressing black wages relative to white ones by the middle of the 20th century, as the industries reserved for whites had more opportunities for upward mobility and became better situated in both the Southern and global economies over time.
First, the extent to which unskilled labor was segregated by race was overstated by Wright. According to the Southern data ranging from the late nineteenth century to 1930 which he compiled (Wright, 1986, Table 6.6) about a fourth of cotton mill laborers were black, as were half of the workers in the saw and planing mills, and about 20% of the laborers in the furniture industry; in the same vein, 30-40% of workers in the tobacco industry were white, and so were the majority of low-level workers in the steel industry. However, it is true that, for whatever reason, blacks working in cotton textiles did not get jobs as operators or loom fixers. Wright argues that, because these workers were almost entirely white before the Civil War, it was impossible for blacks to engage in that work, as they did not have the necessary experience, and it would have been economically inefficient for employers to train them rather than hiring an already trained white (pp. 187-89). This relegated blacks to other industries, which also made it so that whites could not succeed in those, as they lacked experience there. This made segregation efficient for all industries, as those with the necessary experience were almost always of one race. Although the basic premise is sensible, as far as economic theory goes, it is not clear if productivity were dependent enough on experience to cause this.
To be clear, there is quantitative evidence which has been used to show that experience is an important factor. Wright (1981, 1986, ch. 6) primarily relies on evidence showing that worker age was highly correlated with productivity. However, this may have largely been a function of increase in strength as one physically matures. This explanation fits the data better, as it shows not only an increase in wages, but also a decrease in the ratio of female to male wages, as would be expected if strength is a factor (the male-female difference increases rapidly at the end of puberty).5

Evidence on experience directly suggests that, after 3-4 years, adding another few years does little for productivity relative to the increase from the first several (Saxonhouse & Wright, 1984). Because age was not partialled out, it remains a confounder—probably more so for the earlier years than for the later ones—meaning that the increase in the first four years is likely the most overstated. As only a few years were needed to make a new hire almost as productive as a seasoned worker, the cost to the employer who did not only hire whites would not have been as large as might be necessary for Wright’s model. Of course, it is possible that a few years of lower productivity was enough, but the fact that it was only a few years makes it less likely than if it were a higher cost.
Lastly, Wright (1986, pp. 189-192) notes that there were several attempts to run cotton mills with only black employees, but all failed, with the closest observers noting that the failures were caused by inadequate labor. This suggests that, in fact, experience was not the issue, but rather that blacks were simply inferior at this type of work. Southern Cotton mills were able to survive in the 19th century using inexperienced white labor, despite having to compete with an already established, and hence experienced, Northern textile industry, and therefore blacks, if they were equally efficient as whites after taking into account experience, should have been able to keep the mills they worked at alive, too. This did not occur.
To sum up, it is sufficient to say that Wright’s model is not threatening to the overall conclusions of this essay. Industry-level segregation does not count as economic discrimination unless it reduces black wages relative to white ones. Although Wright alleges that the economic segregation practiced in the South did meet this criterion, I do not find his arguments convincing.
Appendix C: DeCanio’s Estimates
In order to estimate what the income distribution of blacks relative to whites would be without discrimination at the time of emancipation, Stephen DeCanio (1979), a skilled economist, developed the a simple equation (p. 187, eq. 6):
Where Yb/Ya is the ratio between the black and white income; SL is the portion of total income that is received by labor if there is no discrimination, and SK is the same figure for capital; Pa and Pb are the portions of the population which is white and black, respectively; and Na and Nb are the total numbers (not portions) of whites and blacks. In words, the equation can be expressed as this:
The ratio of black to white income is equal to the product of the share of income that would be had by labor in the absence of discrimination and the portion of the population which is black, divided by the product of the share of income which would be had by labor if there were no discrimination and the sum of the portion of the population which is white and the share of income that, without discrimination, would be given to capital, multiplied by the quotient of the total number of blacks and whites.
(Note that this model assumes that no property was owned by blacks, and therefore all of their income was labor income; this was probably close enough to being correct to be justified.)
Of course, the value for SL cannot be measured directly, but it can be narrowed down to a range. DeCanio reports the range of 0.3 to 0.7, with the most likely part of the range being 0.4 to 0.6, which is reasonable given the evidence he provides, based on actual production as well as the terms for extant labor contracts and income data from the mid to late 19th century, as well as the early 20th century. This means that the share of income received by labor if no discrimination occurred was almost definitely between 30 and 70 percent of all income, and most likely between 40 and 60 percent. SK must have been between 0.3 and 0.7 as well, and was most likely between 0.4 and 0.6, as it must sum to 1.0 with SL. The rest of the values can be estimated directly. The portions black and white were obtained by DeCanio from the 1880 Census, as were their total numbers. His results looked like this:

DeCanio compared these estimates to Robert Higgs’ (1977, p. 146) estimate of the black-white gap in 1867-68, which was not based on very high quality evidence (see O’Brien, 2000). A better comparison would be with Ng & Virts’ (1993) estimate of the black-white ratio in total income, which was 0.53 for 1880. The reason that this number is higher than all of the best estimates may be due to the population estimates for DeCanio being based on only five Southern states, whereas Ng & Virts’ estimate was for the entire South. Also, despite having little property in 1860, by 1880 a not insignificant amount of property had been accumulated by blacks (Derenoncourt et al., 2022; Higgs, 1982; Margo, 1984b). For example, DeCanio (p. 200) estimated that black Georgians owned 5.1% as much property as the state’s average, per capita. Because they were 47% of the total Georgian population, this translates to a ratio of 0.043 to 1.0.
These calculations by DeCanio show that a large black-white income gap is to be expected purely from the fact that freed slaves did not have much property, and discrimination was not a necessary cause. His conclusion reads:
The main conclusion that can be drawn from these calculations is that the unequal ownership of property by blacks and whites in the postbellum South was the chief source of the race-related economic inequality. The blacks’ emancipation with zero wealth accounts for most of the gap in income between blacks and whites during the Reconstruction period. (p. 204)
References
Akamatsu, R. (2010). The Irish Slaves: Slavery, Indenture and Contract Labor Among Irish Immigrants. CreateSpace Independent Publishing.
Alston, L. & Kauffman, K. (2011). Competition and the Compensation of Sharecroppers by Race. A View from Plantations in the Early Twentieth Century. Explorations in Economic History, 38(1), 181-194.
Bayer, P. & Charles, K. (2017). Divergent Paths: Structural Change, Economic Rank, and the Evolution of Black-White Earnings Differences, 1940-2014. NBER Working Paper, No. 22797.
Becker, G. (1957). The Economics of Discrimination. University of Chicago Press.
Blackwell, M., Daugherty, L., Galvez, E., Garrett, K., Butler, R., Mesa, A., Dorminey, Z. (2024). Racial Disparities in Animal Welfare. Program for Pet Health and Equality. Accessed at: https://trace.tennessee.edu/utk_socipubs/35/
Caplan, B. (2018). The Case against Education: Why the Education System is a Waste of Time and Money. Princeton University Press.
Clark, G. (2007). A Farewell to Alms: A Brief Economic History of the World. Princeton University Press.
Clark, G. & Cummins, N. (2020). Does Education Matter? Tests from Extensions of Compulsory Schooling in England and Wales 1919-22, 1947, and 1972. CEPR Discussion Paper, No. DP15252.
Clark, D. (2023). School quality and the return to schooling in Britain: New evidence from a large-scale compulsory schooling reform. Journal of Public Economics, 223, 104902.
Collins, W. & Margo, R. (2011). Race and Home Ownership from the Civil War to the Present. NBER Working Paper, No. 16665.
Curtin, P. (1969). The Atlantic Slave Trade: A Census. University of Wisconsin Press.
DeCanio, S. (1974). Agriculture in the Postbellum South: The Economics of Production and Supply. MIT Press.
DeCanio, S. (1979). Accumulation and Discrimination in the Postbellum South. Explorations in Economic History, 16(2), 182-206.
Derenoncourt, E., Kim, C., Kuhn, M., & Schularick, M. (2022). Wealth of Two Nations: The U.S. Racial Wealth Gap, 1860-2020. NBER Working Paper, No. 30101.
deSouza, P., Rees, A., Oscilowicz, E., Lawlor, B., Overmann, B., Dickinson, K., McKenzie, L., Magzamen, S., Miller, S., & Bell, M. (2025). Journal of Exposure Science & Environmental Epidemiology.
Dockery, T. & Bedeian, A. (1989). “Attitudes Versus Actions”: LaPiere’s (1934) Classic Study Revisited. Social Behavior and Personality: An International Journal, 17(1), 9-16.
DuBois, W. (1904). Some Notes on Negro Crime, Particularly in the State of Georgia, A Social Study Made Under the Direction of Atlanta University by the Ninth Atlanta Conference. Atlanta University Press.
Dutton, E. (2020). Making Sense of Race. Washington Summit Publishers.
Ellis-Soto, D., Chapman, M., & Locke, D. (2023). Historical redlining is associated with increasing geographical disparities in bird biodiversity sampling in the United States. Nature and Human Behavior, 7(11), 1869-1877.
Eltis, D. (2008). The U.S. Transatlantic Slave Trade, 1644-1867: An Assessment. Civil War History, 54(4), 347-378.
Erskine, H. (1968). The Polls: Negro Employment. Public Opinion Quarterly, 32(1), 132-153.
Fairlie, R. & Sundstrom, W. (1997). The Racial Unemployment Gap in Long-Run Perspective. The American Economic Review, 87(2), 306-310.
Ferleger, L. (1998). The Problem of “Labor” in the Post-Reconstruction Louisiana Sugar Industry. Agricultural History, 72(2), 140-158.
Fishback, P., Rose, J., Snowden, K., & Storrs, T. (2024). New Evidence on Redlining by Federal Housing Programs in the 1930s. Journal of Urban Economics, 141, 103462.
Foote, C., Whatley, W., & Wright, G. (2003). Arbitraging a Discriminatory Labor Market: Black Workers at the Ford Motor Company, 1918-1947. Journal of Labor Economics, 21(3), 493-532.
Friedman, M. (1962). Capitalism and Freedom. University of Chicago Press.
Gabbidon, S. (2000). An early American crime poll by W.E.B. DuBois. Western Journal of Black Studies, 24(3), 167-174.
Galenson, D. (1984). The Rise and Fall of Indentured Servitude in the Americas: An Economic Analysis. The Journal of Economic History, 44(1), 1-26.
Goldin, C. & Sokoloff, K. (1984). The Relative Productivity Hypothesis of Industrialization: The American Case, 1820 to 1850. The Quarterly Journal of Economics, 99(3), 461-487.
Graber, M. (2019). Debunking Howard Zinn: Exposing the Fake History that Turned A Generation against America. Regnery Publishing.
Graber, M. (2022). Debunking the 1619 Project: Exposing the Plan to Divide America. Regnery Publishing.
Hacker, J. (2020). From ‘20. and Odd’ to 10 Million: The Growth of the Slave Population in the United States. Slavery and Abolition, 41(4), 840-855.
Hansen, B. & Hansen, M. (2006). New Evidence on Race Discrimination Under “Separate but Equal.” Essays in Economic & Business History, 24, 120-132.
Herrnstein, R. & Murray, C. (1996). The Bell Curve: Intelligence and Class Structure in American Life. Free Press.
Hicks, P., Woodward, M., Niziol, L., Lu, M., Kang, L., Stagg, B., Jakpor, O., Elam, A., & Newman-Casey, P. (2023). Ophthalmology, 130(4), 404-412.
Higginbotham, A. (1978). In the Matter of Color: Race and the American Legal Process, The Colonial Period. Oxford University Press.
Higgs, R. (1972). Did Southern Farmers Discriminate?. Agricultural History, 46(2), 325-328.
Higgs, R. (1977a). Competition and Coercion: Blacks in the American Economy, 1865-1914. Cambridge University Press.
Higgs, R. (1977b). Firm-Specific Evidence on Racial Wage Differentials and Workforce Segregation. The American Economic Review, 67(2), 236-245.
Higgs, R. (1978). Racial Wage Differentials in Agriculture: Evidence from North Carolina in 1887. Agricultural History, 52(2), 308-311.
Higgs, R. (1984). Accumulation of Property by Southern Blacks Before World War I: Reply. The American Economic Review, 74(4), 777-781.
Higgs, R. (1989). Black Progress and the Persistence of Racial Economic Inequalities, 1865-1940 in S. Shulman & W. Darity (Eds.), The Question of Economic Discrimination: Racial Inequality in the U.S. Labor Market (pp. 9-31). Wesleyan University Press.
Hillier, A. (2003a). Redlining and the Home Owners’ Loan Corporation. Journal of Urban History, 29(4), 394-420.
Hillier, A. (2003b). Spatial Analysis of Historical Redlining: A Methodological Exploration. Journal of Housing Research, 14(1), 137-167.
Hillier, A. (2003c). Who Received Loans? Home Owners’ Loan Corporation Lending and Discrimination in Philadelphia in the 1930s. Journal of Planning History, 2(1), 3-24.
Hoffman, M. (1993). They were White and they Were Slaves: The Untold History of the Enslavement of Whites in Early America. Independent History and Research.
Jordan, D. & Walsh, M. (2008). White Cargo: The Forgotten History of Britain’s White Slaves in America. NYU Press.
Koger, L. (1985). Black Slaveowners: Free Black Slave Masters in South Carolina, 1790-1860. University of South Carolina Press.
Koger, L. (2006). Black Masters: The Misunderstood Slaveowners. Southern Quarterly, 43(2), 52-73.
Kousser, J. (1974). Shaping of Southern Politics: Suffrage Restriction and the Establishment of the One-Party South. Yale University Press.
Kousser, J. (1980). Progressivism–For Middle-Class Whites Only: North Carolina Education, 1880-1910. The Journal of Southern History, 46(2), 169-194.
LaPiere, R. (1934). Attitudes vs. Actions. Social Forces, 13(2), 230-237.
Last, S (2022). Modern Racism and Economic Inequality. Ideas and Data. Accessed at: https://seanlast.substack.com/p/modern-racism-and-economic-inequality
Lehmann, A., Scheffler, C., & Hermanussen, M. (2010). The Variation in Age at Menarche: An Indicator of Historic Developmental Tempo. Anthropologischer Anzeiger, 68(1), 85-99.
Lenk, J., Hartmann, J., Sattler, H. (2024). White Americans’ preference for Black people in advertising has increased in the past 66 years: A meta-analysis. PNAS, 121(9), e2307505121.
Leonard, J. (1984). Antidiscrimination or Reverse Discrimination: The Impact of Changing Demographics, Title VII, and Affirmative Action on Productivity. The Journal of Human Resources, 19(2), 145-174.
Lightner, D. & Ragan, A. (2005). Were African American Slaveholders Benevolent or Exploitative? A Quantitative Approach. The Journal of Southern History, 71(3), 535-558.
Lochheed, M., Jamison, D., & Lau, L. (1980). Farmer Education and Farm Efficiency: A Survey. Economic Development and Cultural Change, 29(1), 37-76.
Mallach, A. (2024). Shifting the Redlining Paradigm: The Home Owners’ Loan Corporation Maps and the Construction of Urban Racial Inequality. Housing Policy Debate, 34(6), 891-917.
Margo, R. (1982). Race Differences in Public School Expenditures: Disenfranchisement and School Finance in Louisiana, 1890-1910. Social Science History, 6(1), 9-33.
Margo, R. (1984a). Accumulation of Property by Southern Blacks Before World War I: Comment and Further Evidence. The American Economic Review, 74(4), 768-776.
Margo, R. (1984b). “Teacher Salaries in Black and White”: The South in 1910. Explorations in Economic History, 21(3), 306-326.
Margo, R. (1990). Race and Schooling in the South, 1880-1950: An Economic History. University of Chicago Press.
Mill, R. & Stein, L. (2016). Race, Skin Color, and Economic Outcomes in Early Twentieth-Century America. Available at SSRN 2741797.
Morgan, K. (2001). Slavery and Servitude in Colonial North America. NYU Press.
Murray, C. (1984). Losing Ground: American Social Policy, 1950-1980. Basic Books.
Murray, C. (2021). Facing Reality: Two Truths about Race in America. Encounter Books.
Murray, S., & Rueben, K. S. (2020, February 26). Racial disparities in education finance: Going beyond equal revenues. Urban Institute. Accessed at: https://www.urban.org/research/publication/racial-disparities-education-finance-going-beyond-equal-revenues
Ng, K. & Virts, N. (1993). The Black-White Income Gap in 1880. Agricultural History, 67(1), 1-15.
NORC (1946). Where UNESCO Begins: The Climate of Opinion in the United States and other Countries. University of Denver.
Nuzzo, J. (2025). Sex Differences in Grip Strength From Birth to Age 16: A Meta-Analysis. European Journal of Sport Science, 25(3), e12268.
O’Brien, A. (2000). Did the Black-White Income Gap Close During the Late Nineteenth Century? in K. Kauffman (Ed.) New Frontiers in Agricultural History (pp. 73-93). Emerald Publishing.
Owens, S., Seto, E., Hajat, A., Fishman, P., Koné, A., Jones-Smith, J. (2024). Assessing the Influence of Redlining on Intergenerational Wealth and Body Mass Index Through a Quasi-Experimental Framework. Journal of Racial and Ethnic Health Disparities, 1-21.
Perry, J. & Schreiner, D. (1990). Analysis of Employment Choices with Special Emphasis on Farm Employment. Agricultural Experimental Station, Division of Agriculture, Oklahoma State University: Bulletin B-795.
Richwine, J. (2011). The Myth of Racial Disparities in Public School Funding. The Heritage Foundation. Accessed at: https://www.heritage.org/education/report/the-myth-racial-disparities-public-school-funding
Roberts, H. (1953). The Impact of Military Service upon the Racial Attitudes of Negro Servicemen in World War II. Social Problems, 1(2), 65-69.
Roth, P., Huffcutt, A., & Bobko, P. (2003). Ethnic group differences in measures of job performance: A new meta-analysis. Journal of Applied Psychology, 88(4), 694-706.
Rushton, P. (1995). Race, Evolution, and Behavior: A Life History Perspective. Transaction Publishers.
Sacerdote, B. (2005). Slavery and the Intergenerational Transmission of Human Capital. The Review of Economics and Statistics, 87(2), 217-234.
Saxonhouse, G. & Wright, G. (1984). Two Forms of Cheap Labor in Textile History in G. Saxonhouse & G. Wright (Eds.), Technique, Spirit, and Form in the Making of the Modern Economies: Essays in Honor of William N. Parker (pp. 3-31). JAI Press.
Schuyler, A. & Wenzel, S. (2022). Historical Redlining Impacts Contemporary Environmental and Asthma-related Outcomes in Black Adults. American Journal of Respiratory and Critical Care Medicine, 206(7), 824-837.
Shuey, A. (1966). The Testing of Negro Intelligence, Second Edition. Social Science Press.
Vedder, R. & Gallaway, L. (1992). Racial Differences in Unemployment in the United States, 1890-1990. The Journal of Economic History, 52(3), 696-702.
Whatley, W. & Wright, G. (1994). Race, Human Capital, and Labour Markets in American History in G. Grantham & M. MacKinnon (Eds.), Labour Market Evolution: The Economic History of Market Integration, Wage Flexibility and the Employment Relation (pp. 270-291). Routledge.
Wilson, L. & Gilmore, H. (1943). White Employers and Negro Workers. American Sociological Review, 8(6), 698-705.
Wright, G. (1981). Cheap Labor and Southern Textiles, 1880-1930. The Quarterly Journal of Economics, 96(4), 605-629.
Wright, G. (1986). Old South, New South: Revolutions in the Southern Economy since the Civil War. Basic Books.
Wright, G. (2022). Slavery and the Rise of the Nineteenth-Century American Economy. Journal of Economic Perspectives, 36(2), 123-148.
Wright, S., Pesta, B., & Kirkegaard, E. (2024). Does Cognitive Ability Mediate Black-White Income Disparities in the USA?. Mankind Quarterly, 65(1), 111-128.
In the words of Whatley & Wright (1994, p. 280), the prior date was “when ‘southern racism’ was surely at its historic peak.” Note also that Whatley & Wright attribute black-white wage differences to workforce segregation and, to a lesser extent, factors such as racial differences in educational resources. For the issues with this conclusion, see above.
The source for this analysis is Margo’s (1984b) Table 6, and the equation used is the starting black-white ratio + ((1 - the black-white ratio) × the variance explained by the variables). For example, in the case of Florida, the black-white ratio was 0.48, as can be deduced from the fact that the wage differential was 0.52. The variance explained by the observed variables was 20.4%, which can be known from the fact that the variance unexplained by these variables was 79.6%. Finally, these numbers can be added to the equation: 0.48 + (0.52 × 0.204), which is equal to 0.586.
The source for this analysis is Margo’s (1990) Table 4.4, and the method was the same as the one described in the preceding note.
The employee records used by Foote et al. (2003) are not strictly representative of the total racial composition of Ford workers during the period under study because they are supplemented by oversamples of black workers as well as workers employed in the early and later years. However, based on the random sample of approximately 0.5% of all workers, it appears that blacks made up approximately 20% of employees over this period. Because the black portion of those employed is known, along with the percentage of each race in a foundry position, it is possible to calculate the portion of foundry workers who were black, which was 67.21% ((0.2 × 0.41)/((0.2 × 0.41) + (0.8 × 0.05)). The equation which can be applied to this situation is 0.0123 = 0.3279y, where 0.123 is the observed premium and y is the true, market premium (i.e., the premium paid to white foundry workers). Solving for y gives the solution of 0.0375.
The proof for the above equation is simple. Suppose that the average wage at some business is $100, and that there is a market premium for working at a certain position, y, which equals 4%. Suppose further that the same business artificially excludes members of group A from the premium for y, but does pay the market premium for members of group B, and that members of group A and B earn the same wages at baseline. Therefore, group A averages $100 at y, while group B averages $104. Group A makes up 25% of those employed in y, while group B makes up the remainder. The average wage at y would, in this case, be $103 ((0.75(104) + 0.25(100)), making the observed premium 3%. It can be seen that the market premium is exactly equal to the observed premium multiplied by one more than the proportion of group A divided by the proportion of group B at y (4% = 3% × (1+ (25%/75%)). This equation can be further simplified to Premium(obs.) = By × Premium(true), or, expressed in words, the observed premium is equal to the true premium multiplied by the share of employees at y who belong to group B.
For example, Nuzzo’s (2025) meta analysis found a moderate male-female difference in grip strength before age 11, which increased rapidly thereafter, especially after age 13. Today, children begin puberty at about 10, with girls, on average, reaching menarche at age 12 and ending puberty at age 14, and boys ending it at 15 (German et al., 2015). Data for the 19th century suggest that the average age at menarche was 15-16, indicating that physical development took place 3-4 years later, which matches the growing male-female gap in productivity in Wright’s table. (The evidence for 19th century menarche is based on data I have collated for an upcoming post, though for now it is sufficient to cite the best extant review of the literature: Lehmann et al., 2010). Note also that the ratio between the sexes’ wages is often taken by economists as an indicator of the relative importance of strength in that occupation (e.g., Goldin & Sokoloff, 1984).
They had to pick the fluffy cloud crop while the Irish slaves had to grabble potatoes. No contest, really.