


CONTENTS
Antiquity (Before 700 A.D.)
2.1. Age at Menarche
2.2. Babylon
2.3. China2.4. Greece
2.5. Ancient Rome
2.6. Egypt
3.1. Age at Menarche
3.2. England
3.3. Germany
3.4. Italy
3.5. France
Early Modern and Victorian (1500-1900)
4.1. Age at Menarche
4.2. Belgium
4.3. Canada
4.4. China
4.5. England
4.6. Finland
4.7. France
4.8. Germany
4.9. Hungary
4.10. Ireland
4.11. Italy
4.12. Japan
4.13. The Netherlands
4.14. Poland
4.15. Portugal
4.16. Russia
4.17. Scotland
4.18. Serbia
4.19. Spain
4.20. Switzerland
4.21. Dutch South Africa
4.22. Sweden
4.23. Turkey
4.24. United States
5.1. Summary
5.2. Implications
1. Introduction
There are many topics on which the majority of people appear to be in possession of a sort of “anti-knowledge”—a widespread but incorrect belief. One such topic is the age at marriage in the past. If asked, most would probably guess an average age at marriage of around the order of 12 years old for girls. In reality, it has never been normal for girls to get married before the completion of puberty, except, perhaps, in political marriages between elites, in which cases consummation would not occur until maturity. Here are three examples of anti-knowledge in action, from three completely different types of texts, none of which cite any quantitative evidence:
Lyman Stone wrote in a Substack post that “[w]e know from textual records and from historic mortality patterns that Romans started marrying off girls and trying to impregnate them at 12, often pre-pubescently (they didn’t, uh, quite get how stuff works)”. (NOTE: Lyman Stone commented on this post, saying that his claim was not that 12 was not the average age at marriage, but, rather, the earliest age at marriage. But see this endnote for why he is still probably wrong). 1
The Wiki page for Child Marriage says that “[p]rior to the Industrial Revolution, women around the world were often married at an early age, usually soon after reaching puberty”.
Malamitsi-Puchner and Konstantakos (2023, p. 1373) claimed that females in Ancient Egypt married “at 12–14 years” (p. 1375).
All of these claims are, of course, completely made up—either by the authors themselves, or by someone else. In reality, very few societies with the relevant data have ever had an average female age at marriage below the late teens—in the majority of Medieval and Early Modern societies, the average age was in the early or mid twenties, while, in the ancient world, it was typically in the late teens.
Despite the good quality of the data, and the relative ease of interpretation, I am aware of only three prior attempts to synthesize such data. First, John Hajnal’s (1965) essay reviewed the very limited data available at the time, focusing on the differences between Western and Eastern Europe in the Victorian era, but sometimes extending into the Early Modern period. The next was Michael Flinn’s book The European Demographic System, 1500-1820 (1981), in which a few appendix tables and one chapter are dedicated to marital ages. Lastly, Maryanne Kowaleski (1998) summarized data from dozens of studies on many European countries, in two different appendix tables, A1 and A2, focusing on years before 1550 and from 1550 to 1800, respectively. This was, by far, the most thorough attempt up to that point, and that is still the case. In many cases below, I have cited her tables because I was either unable to find the original study, or because it was written in a foreign language. These literature reviews all have two things in common: 1) they only examine European data, and 2) they are almost entirely restricted to the period after 1500. In this post, I have expanded the range of studies reviewed both temporally and spatially. Instead of stopping at about 1500 A.D., I’ve included data going back to the second millennium B.C. Additionally, I have broadened the focus beyond Europe to include all countries for which such studies exist. My results are congruent with what was found by the three authors just cited—with very few exceptions, girls have always typically married in their late teens or early to mid twenties. I also improved on previous literature reviews by examining whether the average girl was mature at the time of her marriage. (see the section below for how I estimated this).
1.1. Notes on Methodology
For the purposes of my review, I have not had to do anything difficult to extract averages from the studies; sometimes, I calculated them from tables showing the number of cases by age, and, in other cases, I have had to guess them by looking at a graph. Sometimes, I have had to take the median as the average. The only type of revision I have made to any of the numbers reported by the authors was as follows: in some cases, half a year had to be added to the average because of the method used to calculate ages. This is because the average person of any given age will be, approximately, halfway to the next age; so that, for example, an average 13 year old is really 13.5, the average 14 year old 14.5, and so on. This is an issue whenever age at marriage is calculated using stated ages, but not an issue when age at marriage is calculated by finding the difference between marriage year and birth year; the reason for this is obvious—the average birth in a given year occurs halfway through that year, and, likewise, the average marriage will occur at a year’s midpoint, so that this formula, on average, accurately estimates actual age. John Hajnal (1953) developed what is currently the most commonly used method for calculating average ages at marriage from census returns, but his method still suffers from this issue. In most cases, when this adjustment must be made, I will not mention it in the text, because it would not significantly alter the reader’s impression of that one estimate. However, when the difference is worth being noted, I will, of course, do so. In the table that summarizes my research, the necessary adjustment will always be made.
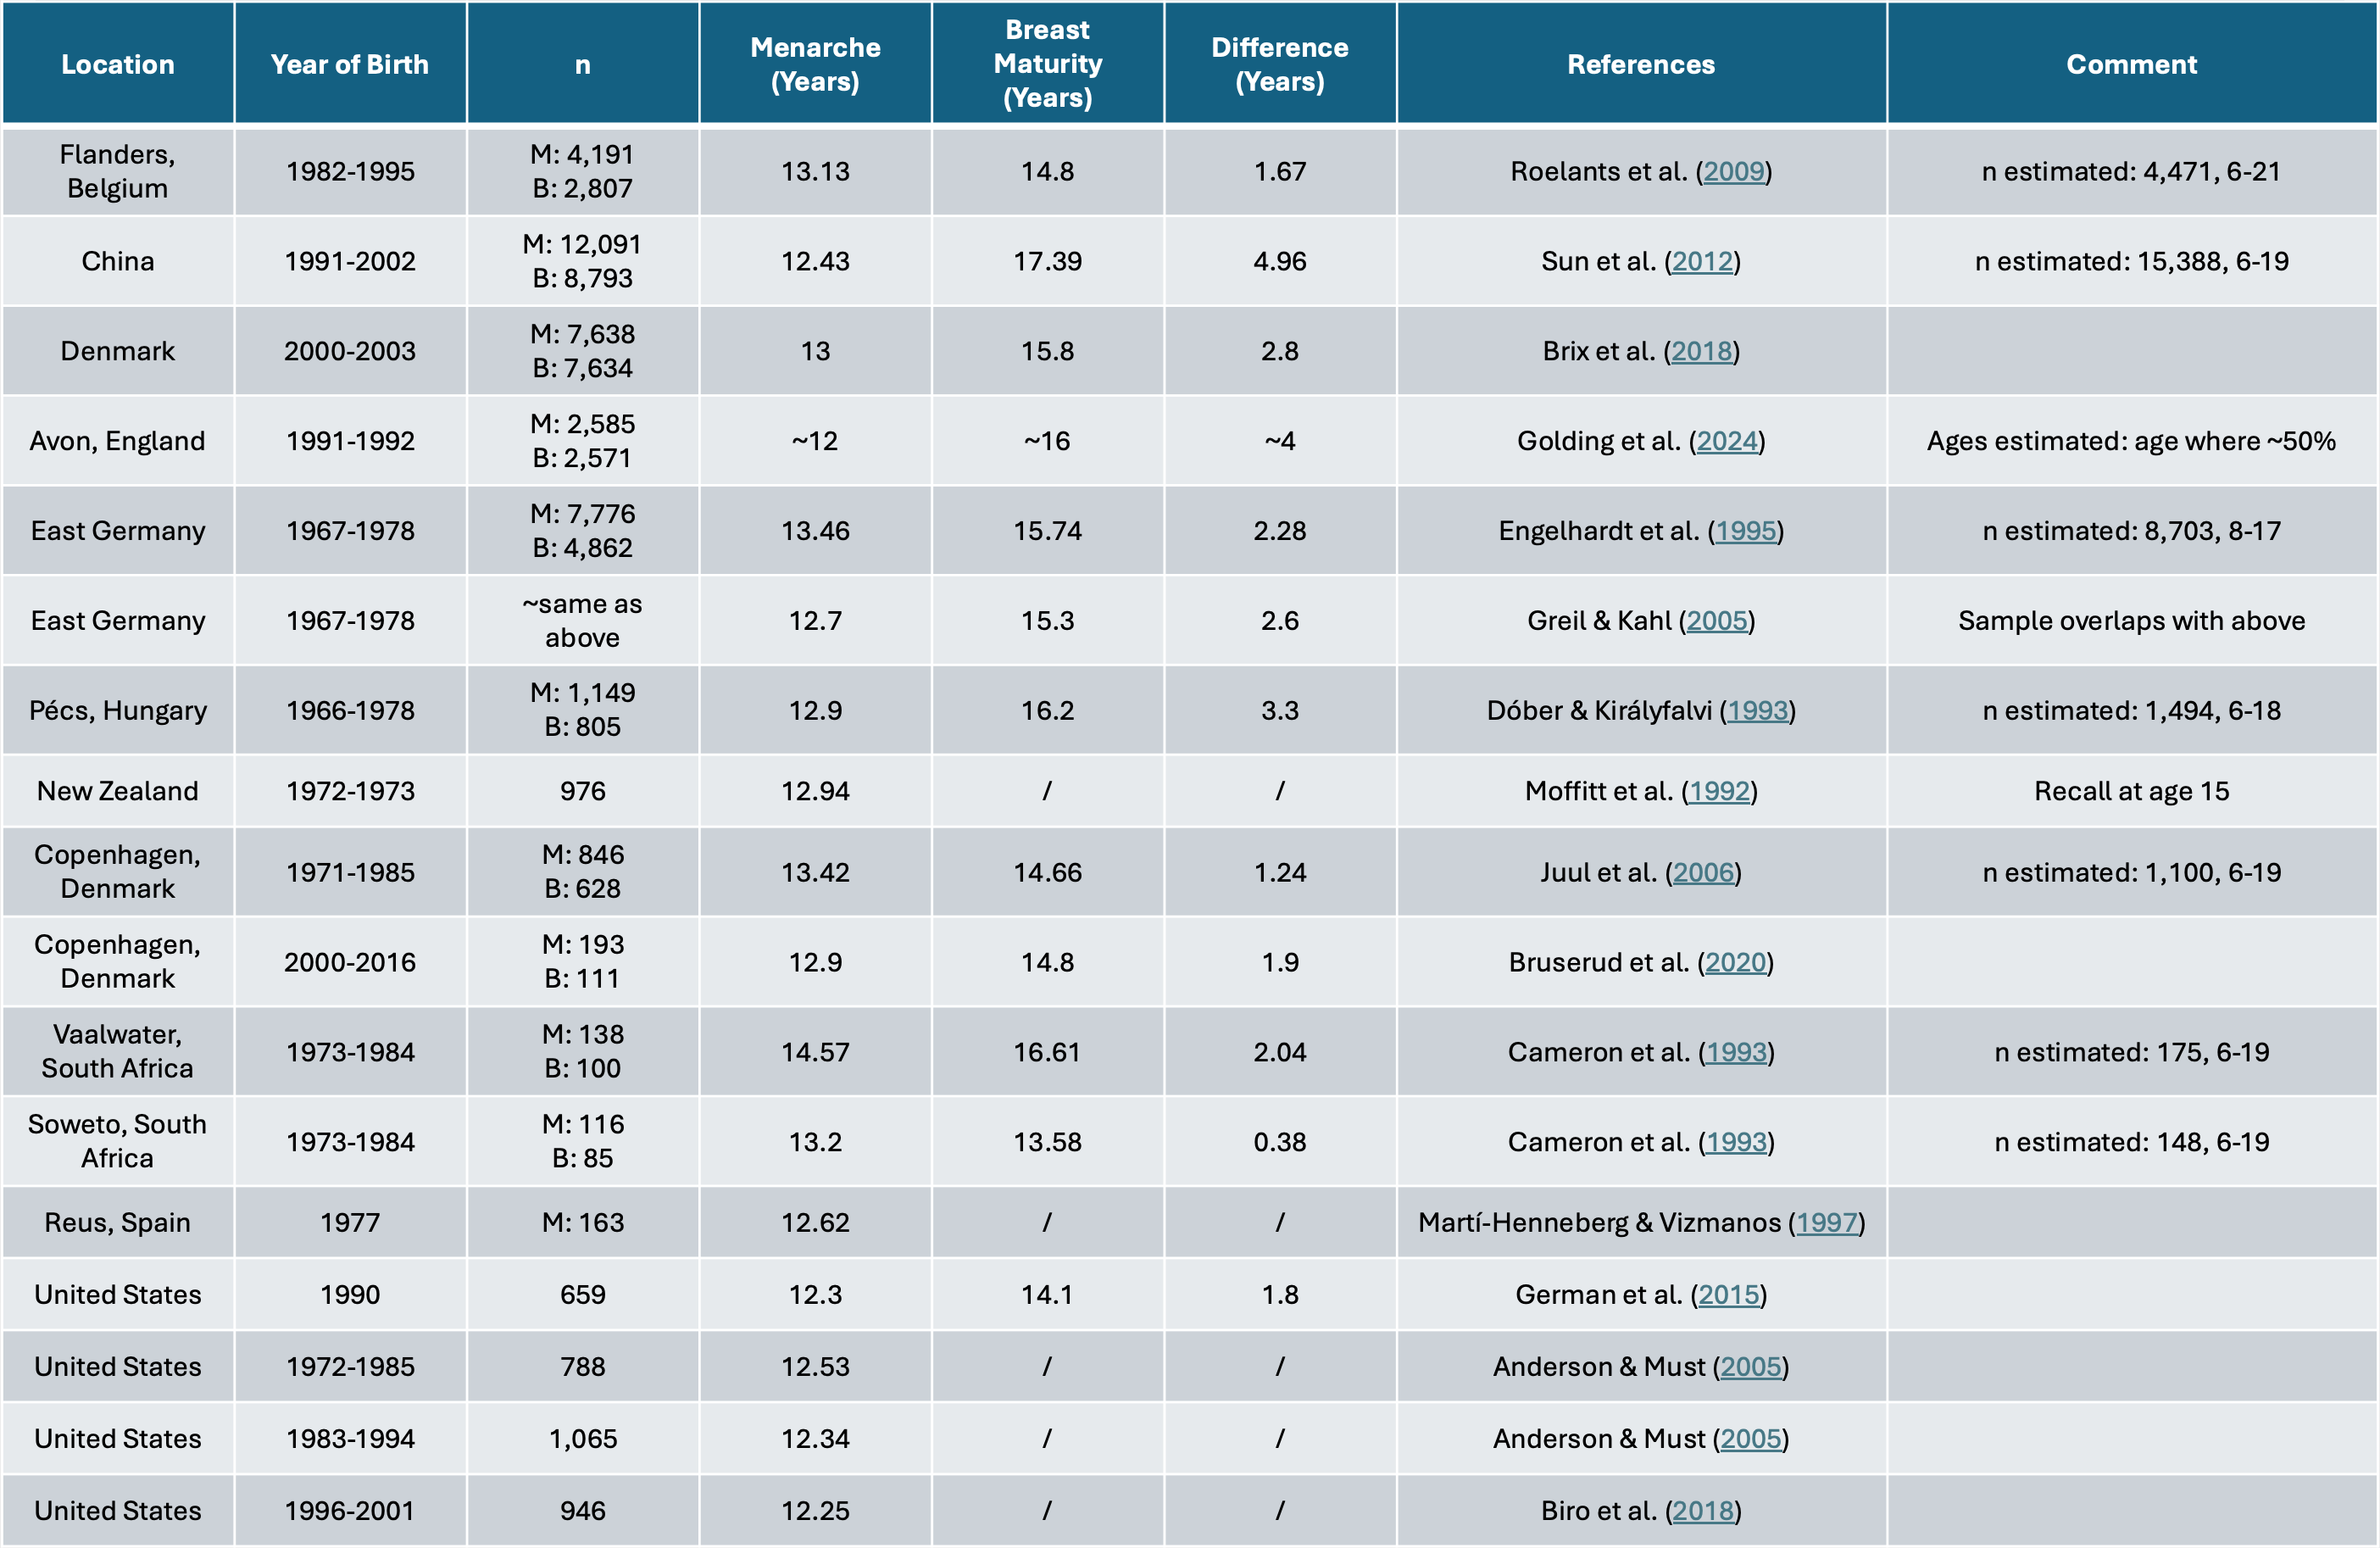
As part of this review, I wanted to also see if girls were typically finished with puberty when they married, as that may explain some variation in age at marriage. Unfortunately, though, such data is typically unavailable, and the closest proxy is the age at menarche. Today, menarche typically begins between ages 12 and13, depending on the population, while the end of puberty (i.e., breast maturity) occurs between 14 and 16, the time between these two stages ranging from less than half a year to four years, but typically being two years (see the table below). Keep in mind, of course, that these are averages between countries, and that is what I am referring to when I talk about variations. To be conservative, I have adopted the following system: if the average marriage occurs more than four years after menarche, then the average girl is physically mature at marriage; if it occurs more than two, but less than four years, after menarche, then I judge that it cannot be said for sure whether the average girl was mature at marriage; and, lastly, if the average age at marriage is less than two years greater than the average age at menarche, then I have assumed that the typical girl was immature at the time of her marriage. For the Medieval and Classical periods, I rely on literary evidence to figure out at which age menarche occurred, while, for the early modern period, I use quantitative data, mostly pertaining to the nineteenth century.2
2. Antiquity (Before 700 A.D.)
2.1. Age at Menarche
Evidence is available principally from an old paper by Amundsen & Diers (1969). The authors quoted from many Greek and Roman authorities, and these references will be summarized here. Hippocrates (5th cent. B.C.) wrote that some diseases are rare before puberty, and adds, “[t]he body is especially susceptible to these diseases between the fourteenth and forty-second years”. Aristotle (4th cent. B.C.) said that boys begin producing sperm after fourteen years, at which time, for girls, “the menses begin to flow and this fluid resembles fresh blood”. Soranus (1st cent. A.D.) agreed with the other two observations, saying that “[m]enstraution first appears around the fourteenth year for the majority”. Rufus, according to the authors a contemporary of Soranus (and, therefore, 1st cent. A.D.), said of puberty, “[o]n average, they perceive the change around the fourteenth year”. Galen (2nd cent. A.D.): “Some begin puberty at once at the completion of the fourteenth year, but some begin a year or more after that. Oribasius (4th cent. A.D.): “In the majority the menses begin around the fourteenth year, in a few around the thirteenth or the twelfth, and in many later than fourteen years”. Macrobius (4th cent. A.D): “After fourteen years, by the very necessity of years, one becomes pubescent. Accordingly then the generative power in men and the menses of females begin to be aroused”. These medical writers appear to define pubescense to be coincident with menarche in women and spermarche in men, as is evidenced by the authors that talk of puberty when describing menarche and spermarche (Aristotle and Macrobius), and by the concordance of the estimates given by authors speaking simply of puberty and those speaking of menarche. Today, spermarche and menarche are considered to happen during the third or fourth Tanner stages, and, therefore, come several years after the commencement of puberty.
Acknowledging that the beginning of puberty, when mentioned by these authors corresponds to menarche, it can be seen that the first period was reached by Roman and Greek girls around the time of their fourteenth birthday. (Note that many authors used phrases like “the fourteenth year”, which actually means refers to the age 13, as one’s first year is the one during which they are “zero”, preceding their turning one.)
Hopkins (1965, p. 310), preceding Amandsen & Diers (1969), mentions several authors who agree with a menarcheal age of around 13, of whom two do not overlap with those given by the latter study. These two authors are Caelius Aurelianus (probably fifth cent. A.D.) and (Helvius) Vindicianus (4th cent. A.D.), but no specific quotes are given.
Lastly, Datta & Gupta (1981, Table 1) summarize the literary evidence from Ancient India. The years range from 10-13, but the modal age is 12 by a large margin. It is possible, then, that puberty in India occurred earlier by about one year, but, because the evidence for Rome and Greece is more abundant, clearer, and also more consistent, I take the age at menarche as 13—note that this is a slight compromise, as age 13 is actually age 13.5, as proven above. This means that women were almost definitely mature by age 17.5, while cases between that age and 15 years would be borderline. Women under fifteen would be considered physically immature.
2.2. Babylon
Jonathon Tenney has extensively analyzed records pertaining to Babylonian slaves in the 14th and 13th centuries B.C. (for a description of the sources, see Tenney, 2011). He estimates that female indentured workers married at a little under 23 years on average (2017, pp. 750-751). To this would have to be added another half year because the estimate comes from stated ages, so I increase it to 23 (note that he never explicitly says how much lower than 23).
2.3. China
To my knowledge, there is no quantitative data for ancient China, but there is evidence significantly stronger than literary: a law, decreed in 627 A.D., that any girl older than fifteen or man older than twenty be forced to marry the other, by the local magistrate, if they are unmarried (Baber, 1934, p. 132). If all girls above the age of fifteen were forced into marriage, the average age at marriage must have been slightly lower than 15.
2.4. Greece
The literary evidence for when Greeks married has been summarized by Wayne Ingalls (2001). He found several pertinent quotes. Hesiod (8th century B.C.) wrote that the woman a man marries ought to “be four years past puberty”. Ingalls reasoned that this refers to marriage four years after menarche, which would correspond to age eighteen or nineteen, as “girls normally reached puberty at fourteen” (p. 18). For the claim that girls reached puberty at fourteen, Ingalls cited Amundsen & Diers (1969), whose evidence is related above. Many authors actually wrote of menarche as being reached in the fourteenth year—which, remember, corresponds to age thirteen—and not after the fourteenth year. Probably, a better estimated average age at menarche in Ancient Greece would be 13.5, rather than 14, which would bring the age at marriage suggested by Hesiod to 17.5.
Plutarch (1st cent. A.D.), according to Ingalls, says that marriage took place at age 17 in Keos (an island in Greece), with no apparent mention of sex differences. The same writer also says this of the Spartans: “They married women by seizure, not when they were small and unready for marriage, but when they were in full bloom and ripe”, presumably referring to some time after the onset of menarche, and, perhaps, after the termination of puberty. The same greek word, translated by Ingalls as “ripe”, is used by Plato (4th cent. B.C.) when he says that the best time for bearing children began at age 20, and, Ingalls argues, that was probably the age that Plutarch had in mind when he says that Spartans waited until girls were “ripe” before marrying them. Plato himself appears to have placed the age of marriage at between 16 and 20, or, perhaps, 18 and 20; Aristotle (4th cent. B.C.), being more specific, proposed eighteen as the best age for a girl to marry.
These ancient writers appear to agree that the late teens was the ideal age for a woman to get married, and, though this is less clear, that this really was the age at which women married at that time, in Greece. However, Ingalls notes that there is some literary evidence that is often cited to the effect that the female residents of the capital, Athens, married much earlier. Xenephon’s Oeconomicus mentions two women that married young, one at age 14, and another when, in Ingalls’ words, “she was a very young child” (p. 21). Yet another was supposed to get married at fifteen. Aristotle is also supposed to have written that Athenian heiresses had their property leased to them by the eponymous archon until age fourteen, which can be theorized to relate to age at marriage.
However, two major facts make this evidence doubtful. First, the age given by Aristotle was lost to time, and restored by Fridericus Blass, a 19th century translator. The age can be any number that ends with the Greek letter alpha, including, say, 17 or 19. Second, the dialogues in Xenephon’s work are taught, by many scholars, to be largely fictional (and this is also my impression, from having read two of his books), and, therefore, the two young marriages, and the one young marriage to be, may not really have happened. If, furthermore, these ages were real, it is possible, argues Ingalls, that they only represent the marital ages of aristocratic girls, and not the average Athenian woman. Overall, Ingalls concludes that (p. 28):
The evidence of early first marriage for Athenian girls is anomalous in light of what we know from the rest of Greece, where almost all other testimony points to marriage in the late teens and even early twenties. Moreover, the evidence from Athens is open to doubt. The examples of girls who marry at fourteen and fifteen are drawn from the elite, whose marriages tend to be early in most societies. The testimonium regarding epikleroi [heiresses] from the Constitution of the Athenians rests on a modern conjecture, not solid textual evidence.
Because of the strength of this qualitative evidence, I am confident in saying that Greek girls did not typically marry before about age 18, and, at the very least, they were physically developed at marriage.
2.5 Ancient Rome
The first serious inquiry into the age at which girls married in Ancient Rome was written by Hopkins (1965) in an article titled “The age of Roman Girls at Marriage”. Hopkins combined two datasets of funerary inscriptions, including a total of 287 girls whose age at marriage can be calculated, and whose age at marriage is between 10 and 24. This restriction was used partly to defend the statistical data from being swayed by outliers, and partly to decrease the likelihood that the marriage was not the girl’s first. Within this restricted sample, the average age at marriage was 16.82 for Christian girls (n=157) and 15.5 for Pagan girls (n=130).
In the total sample, which includes 325 girls, the range of age at marriage is from 6 to 45. From Hopkins’ data (p. 321, table I), the average age at marriage can be calculated as 17.81. (Note that the lowest age at marriage is denoted as “6-7” in the table, for the two girls to whom it corresponds; because there are just two girls in this category, it obviously consists of one girl aged six, and another aged seven, at marriage.) For Pagan girls specifically (n=145), the average in the total sample would be 16.97; for Christian girls (n=180), 18.69. Taking out cases where women married after age 35, which were almost definitely second marriages, lowers the average to 17.4 years. Joseph Bronski analyzed this same data using a statistical tool which allowed him to predict age at first marriage based on the shape of the distribution; his estimate for girls was 15.66 years. I asked him to separate pagan and Christian girls, but the difference turned out to be statistically insignificant.
Another sample of inscriptions was looked at by Herlihy (1985, Table 1.1), for approximately the years 250 to 600 A.D. In the total sample of 160 females, the average age at marriage was 18.81; if those above age 30 are removed from the sample (n=9), then it is 17.77. This sample differs from Hopkins’ because it only includes Christians (because the database used, the ILCV, only has Christian inscriptions) and because it is for a later time period.
Another line of evidence comes from commemorations found in the same kinds of funerary inscriptions. When a deceased woman is commemorated by her husband, she must have been married; on the other hand, if she is only commemorated by, say, her mother, it is less likely that she was married at the time of death. Commemoration by children, too, suggests marriage, though age at first birth must have been higher than age at first marriage. Such evidence seems to be most consistent with a marriage age in the late teens for girls, though it is also compatible with a marriage age in the mid-teens (Scheidel, 2007).
Finally, in their The Age of Marriage in Ancient Rome (2003), Lelis and his colleagues present their alternative data, based on literary descriptions of when girls married. In an appendix (Appendix II, pp. 121-25), descriptions of the evidence for when 31 girls living in Rome married is provided. Of these, I removed one because she is said to have married at age 52(!), leaving me with a sample size of 30. Occasionally, a range of ages was given, in which cases I took the midpoint of the lower and higher numbers. Doing this leads to an average age at marriage of 14.87.
This age is significantly lower than what is obtained through the other estimates. This is most likely because their sample is much more skewed toward upper class society, as it draws only on those cases that made it into literary works.
2.6. Egypt
Bagnall and Frier, in their The Demography of Roman Egypt (1994), analyzed surviving census returns from the first few centuries A.D. in Egypt, which was then under Roman control. Based on 206 free women, for whom it was noted whether they had ever been married, they estimated that it was not until about age eighteen that half of all women had been married, making that approximately the median age of women at marriage (Figure 6.1).
3. Medieval (700-1500)
3.1. Age at Menarche
As far as literary evidence goes, J. B. Post (1971) was the first to write a detailed review. According to him, a sixth century author stated that “menses begin to occur in women around the fourteenth year”. He also cites Trotula, whose writing he dates “to the second half of the eleventh century”. The original manuscript has not survived, and the various ones which are extant differ in terms of the ages that they point to for the beginning of menstruation, ranging from the thirteenth to the fifteenth year. Most say the fourteenth. In the late fourteenth or early fifteenth century, a book was published, which claimed that menarche occurs at between the ages of 12 and 14. Gilbert Anglicus, on the other hand, simply stated that no girls reach menarche before the age of 12, writing in the thirteenth century. Another thirteenth century author put the age at 13, while another agreed, but also allowed for menarche at age 12. An early fourteenth century source, based purely on past writers, gives a range of 12-14 years. Finally, “a fifteenth-century medical treatise in three parts” says that menarche is reached at age 12.
Shortly after Post’s article, Amundsen & Diers (1973) published a much more extensive overview. The first author they cite is Aetius, who wrote that menstruation first occurs in girls “around the fourteenth year”. Next, they quote Paulus Aeginata, writing in the seventh century, as saying that, for “the majority, the menses begin around the fourteenth year, in a few sooner, during the thirteenth or twelfth, but in many later than the fourteenth year”. In the twelfth century, one author wrote vaguely that “it is contrary to nature” for a girl not to menstruate on their fifteenth year, probably meaning that menarche must have typically occurred earlier than that age. Plataerius, writing at about the same time, narrows down the range further, by saying that it is unnatural to reach menarche before the twelfth year. After this, the authors cite a passage written by a 12th century nun, which might be taken to imply that menarche should be reached sometime between the twelfth and fifteenth years of a girl’s life. Four thirteenth century authors are cited, of which one overlaps with Post. The three original contributions are two statement to the effect of menarche occurring at age 13, and one (Aquinas) must be excluded because he relied on ancient sources, whom he seems to have misquoted. Lastly, Amundsen & Diers quote a German author who writes that periods occur in girls above the age of 12.
The vast majority of the medieval literary evidence, then, suggests that the average girl reached menarche at age 13, with an approximate range of 12-14 years. One further reference can be made to estimates from Tang Era (618-906) Chinese medical literature, in which it seemed to have been understood that menarche occurs at age 14 (Medvei, 1982, p. 16).
There are a few archeological studies that can be cited, all of medieval England. Lewis et al. (2016a) estimated, using skeletons from four different English sites, that menarche was reached between ages 15 and 17. Physical maturity, based on skeletal developments, was achieved between ages 16 to 22. Confusingly, Lewis et al. (2016b), in an analysis of the same sample for a different purpose, noted that 98.7% reached menarche between ages 14 and 15. Finally, DeWitte & Lewis (2021) used a (new) sample of 74 female skeletons, from late medieval London. They then divide the period into three different eras: before the Black Death, around the time of the Black Death, and after the Black Death. They find that age in menarche decreased after the black plague, and theorize that this is due to better living conditions, but do not explicitly state their estimate of this age. Based on their figures, my guess is that it went from something like 16-17 to 15-16, but the sample size is small and, again, this is my guess based only on how the box charts look. Because this field is very new, and the method used is evidently imprecise (look at the ranges above!), I will give more weight to the literary evidence (this also appears to have been the decision made by Papadimitriou, 2016).3
Because menarche occurred, on average, at age 13, any age below 14.5 would be considered immature, while maturity would, on average, occur at age 17. If the average is between these ages, then the society would be considered borderline.
3.2. England
In his book Life, Marriage and Death in a Medieval Parish: Economy, Society and Demography in Halesowen 1270-1400, Zvi Razi (1980) used manorial court records to learn various things about medieval demography. Because appearance in court was so common, and is especially so in the case of marriages, which was subject to taxation, it is possible to estimate average ages at marriage with some certainty. Razi states the following (pp. 60-61):
Manorial court rolls do not provide data to compute the mean age at first marriage of males and females. But it is possible to take three-generation families and to estimate crudely the age at marriage of a number of men and women. If sons in Halesowen did not have to wait until their father’s death to obtain land, and if they were prepared to start their independent life with a part of the family lands and sometimes even with quite a small holding, it is likely that many of them did so as soon as they reached the age of 20, the minimum legal age for holding land. Many other sons must have obtained land at about 20, either because they were at that age or because they were minors when their fathers died. If this hypothesis is true, and as on average tenants appear in the records at least once in three years, we can assume that when a son of a resident villager appears in the court rolls for the first time as a landholder, he was between the ages of 20 and 23. If between seventeen and twenty-three years later his son appears in the records as a landholder, we can assume that he was married at about the age of 20. And if he had a daughter who is noted in the records for paying merchet [the marriage tax], say, sixteen years after his first appearance as landholder, we can assume that she was married between the ages of 16 and 19. The method described above is effective only in those cases when the first-born son or daughter survived maturity. If only the second- or third-born son or daughter of a villager survived to maturity, they appear in the records—the son as landholder and the daughter for paying merchet—more than twenty-three years after his first appearance in the records as landholder. As infant and child mortality was heavy in the period under study, such cases must have been numerous.
Despite the inexactness of his methodology, Razi was able to conclude that most men and women probably married at between 18 and 22, with the comment that “it seems that men and women married at approximately the same age”, though it is possible that “there could be have been an age gap of three or four years between the spouses at first marriage which our crude method of estimating age at marriage cannot detect” (p. 63). This estimate was for the period 1280-1349. For the rest of the fourteenth century, “[i]t is likely that the mean age at marriage fell” (p. 137). Razi based this statement off of some data showing that poorer girls were able to get married more easily after the Black Plague wrecked the parish. It is fair to say, then, that the little information that is had about this population suggests women marrying in the late teens or early twenties.
Goldberg (1992) criticized Razi’s (1980) method, writing that it probably underestimated the age at marriage due to the assumptions he made, arguing that the same evidence could be used to estimate higher ages at marriage (Goldberg, 1992, pp. 204-212). Furthermore, Goldberg produced some data of his own: in an examination of the poll tax of 1377, he found that only ~55-60% of medieval Englishwomen above the age of 14 were married, a rate similar to men in the same communities (within a single location, the sexes never differed by more than 6.4 percentage points, and usually only by 1 or 2) and also much lower than for women in medieval Tuscany, where ages at marriage are known to have been in the late teens (see below; pp. 215-217). Furthermore, data from deponents in York cause papers suggest that many women remained unmarried into relatively late ages, and that husband-wife pairs did not, on average, differ much in age; in fact, the wife was the same age as, or older than, the husband in over a third of instances (pp. 217-232). This evidence pulled together probably suggests a marriage age in the early twenties, or in the upper half of Razi’s range.
Hallam (1985) has used yet another crude method for five Lincolnshire villages, from 1252 to 1478. Specifically, he used surviving local records, including those on the marriage tax, and estimated minimum and maximum ages at marriage for whichever cases he could (when he could not estimate a minimum, he used the legal requirement, viz., 12 years old for girls) and then estimated the age as the midpoint of the two. Here is an example he gave:
In 1324/5 a woman married whose father was unmarried and living with his father in 1268/9. This woman’s father married in 1287/8 and his widow re-married in 1311/12 and was alive in 1324/5 to pay her daughter’s merchet. The woman was, therefore, born between 1288/9 and 1311/12 and must have been between 13 and 36 years old. I have taken her age at marriage as 24½.
He also used a second method, with different sources, but did not describe it in as much detail. I do not focus on it here, because 1) its sample size for women was much smaller—n=20, compared to 182 from the first method—and 2) because its results, while different, were different in the direction toward higher ages, by several years. Hallam’s calculated ages at first marriage during the entire period are presented in the following table (p. 61; Method A):
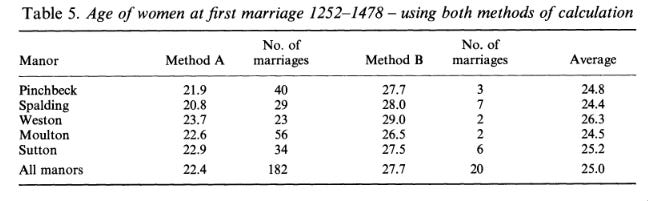
It can be seen that the average of all 182 marriages is 22.4, and there is not much variation between manors. The youngest average is 20.8, and the oldest is 23.7. This paper also presents marital age data from the pre plague period specifically (1252-1348), and for the post plague period (1349-1478). Of 128 marriages that occurred before the plague, the average bride was 21.4 across all manors, with a manor level range of 21.1-22. After the plague, 54 marriages correspond to an average age of 24.6, with an intermanorial range of 20.7-27.2. Though the range for the latter period is much higher, this can be explained by the much smaller sample size. The village with the youngest age in the post plague period was Spalding, with a sample size of 10, while the village with the oldest brides had a sample size of 9. Comparatively, the villages with the lowest and highest average ages at marriage in the anteplague period had sample sizes of 31 and 40, respectively. In conclusion, Razi’s and Hallam’s studies both reinforce each other, finding that approximately 20 is a good estimate for the average age of marriage in late medieval England. Hallam’s study, because it computed precise means, should be trusted over Razi’s; but it should be emphasized that neither study is very strong on its own, and both researchers were forced to make various assumptions, that may or may not be proved tenable with future research. Goldberg’s evidence is probably the weakest, but it is also generally in agreement with the other two.
Podd (2020) as part of a study on maternal mortality, collected a database of 102 aristocratic women, whose history of pregnancy and birth are recorded, “from the marriage of Eleanor of Provence to King Henry III in 1236 to the death of Elizabeth of York in 1503” (p. 118). All of these women, then were born from the early 13th century to the late fifteenth century, and the sample size is not much worse than what was used in Hallam’s (1985) study. However, the age at marriage must be calculated from the age at which the the woman first became pregnant, and that figure is only available for 84 of them. The average age at first pregnancy was twenty, and just six (7.14%) got pregnant when younger than fifteen. Now is left the issue of how age at marriage can be deduced from this information. The most basic procedure would be to subtract one year from the age at pregnancy, giving a difference of 19. However, data from early modern Western Europe suggest that, on average, 1.25-1.50 years passed between marriage and first birth (Clark et al., 2024; Flinn, 1981, Table 3.5), which would translate to a 0.5-.75 year gap between marriage and pregnancy (assuming that pregnancy lasts nine months). Either way, the estimated age at first marriage is in the late teens, somewhere between 19 and 19.5, with very few aristocratic girls marrying before age fourteen.
Kowaleski (1998, Table A1) also provides more data from three groups of elites. She refers to these as the “Bristol elite”, “London merchant elite”, and “London elite”, with sample sizes of 18, 41, and 17, respectively, and with averages ages at marriage ranging from 16.8 to 19.1. The weighted average of these figures is 17.42 years.
The final data that could be used to calculate the typical medieval noblewomen’s age at marriage come from Parsons (1998), who compiled a list of 87 marriages from three elite families—“the Plantagenets, the Mortimers of March, and the Hollands of Kent” (p. 66)—occurring between 1150 and 1500. Unfortunately, he does not provide much quantitative analysis of this list in either this or any future publication, and the list itself has never made it to print. All of the numbers he does give can be summarized as follows:
38 (43.7%) married before age 15.
Of these, many did not have their first child until three or more years after the marriage, and only 7 had a child before age 15, of which two births occurred within a month of the girl turning 15.
The rest (49, or 56.3%) married at 15 or older.
Parsons also provides a lot of qualitative evidence supporting the fact that, when the bride was young, the marriage was typically not consummated until she was more developed. This evidence supports a median age at marriage of just over 15, but, if consummation is counted for marriage, rather than the wedding ceremony, the median age would probably be in the range of 16 to 18.
3.3. Germany
The only Medieval evidence that I am aware of comes from a quotation by Herlihy (1985) of an important study, which, to my knowledge, has never been translated into English. He writes, (p. 106)
Some Years ago, Richard Koebner examined marriages in the late Middle Ages, for both the German nobility and the town patriciates. Noble girls were especially young at first marriage. In the noble family of Wittelsbach, from 1300 to 1520, four brides were between 12 and 13 years; eight about 14; and two about 15. Among the Hohenzollern, five brides were between 12 and 13, five about 14; and five about 15. And among the Nassau, one was 12; two were 14, and three were 15. Among the patricians of the town of Frankfurt, the average age of 43 brides was 18.8 years.
It is unclear if all marriages from the nobility were included, or just the youngest ones. Especially because only ages 15 and younger are mentioned, it seems likely that only some marriages are included. In total, he mentions 35 marriages among the aristocracy, and the average age is 13.84 (if those in the range of 12-13 are counted as 12.5 years old). The 43 marriages from Frankfurt nobility average to a female age of 18.8 years. If this number is averaged with the other one (weighted for sample size), it becomes 16.58. Depending on how these ages were estimated, it is possible that another half year should be added. This would make an average for the German nobility of a little over 17. Furthermore, my impression is that 18.8 is a much more useful number than the average of both, as it is uncertain whether the other figure includes only exceptionally young brides. Note also that Kowaleski (1998, Table A1) also cited the same figure for Frankfurt, from the same German author, but did not cite the other elite groups’ averages, suggesting that those were not meant to be statistical.
3.4. Italy
Late Medieval Italian data on age at marriage is both the best known, and of the highest quality. The most major study was published by Herlihy & Klpaisch-Zuber (1985) in their analysis of the 1427 Catasto (a type of census). Their figures show a mean ages of girls at marriage of 18.86 and 19.28 in the urban and rural populations of Tuscany, respectively (pp. 205-206). These figures were arrived at by taking advantage of the fact that the Catasto allowed corrections until 1430, and the fact that, upon marriage, a bride would have to be registered by her new family (her in laws). By looking at the average age of the wife in the corrections only, it is possible to see what her age was at the time of marriage, as that would coincide with the time that the correction was made by the groom’s family. But there are two other ways to measure marital ages from this source.
One other way was to, instead, estimate a wife’s age at marriage by looking at cases where the household she left upon marriage changed their Catasto declaration, noting that she was no longer part of the household, as well as when she got married. The final method is one in which the “[a]ge at first marriage estimated by the proportions of single men and women found in successive age groups within a census. The figures essentially show the average number of years which those who subsequently marry are likely to spend in single life before taking a spouse” (p. 207). This is Hajnal’s (1953) method mentioned in the introduction. The authors present the estimates made by all three estimates in the following table:
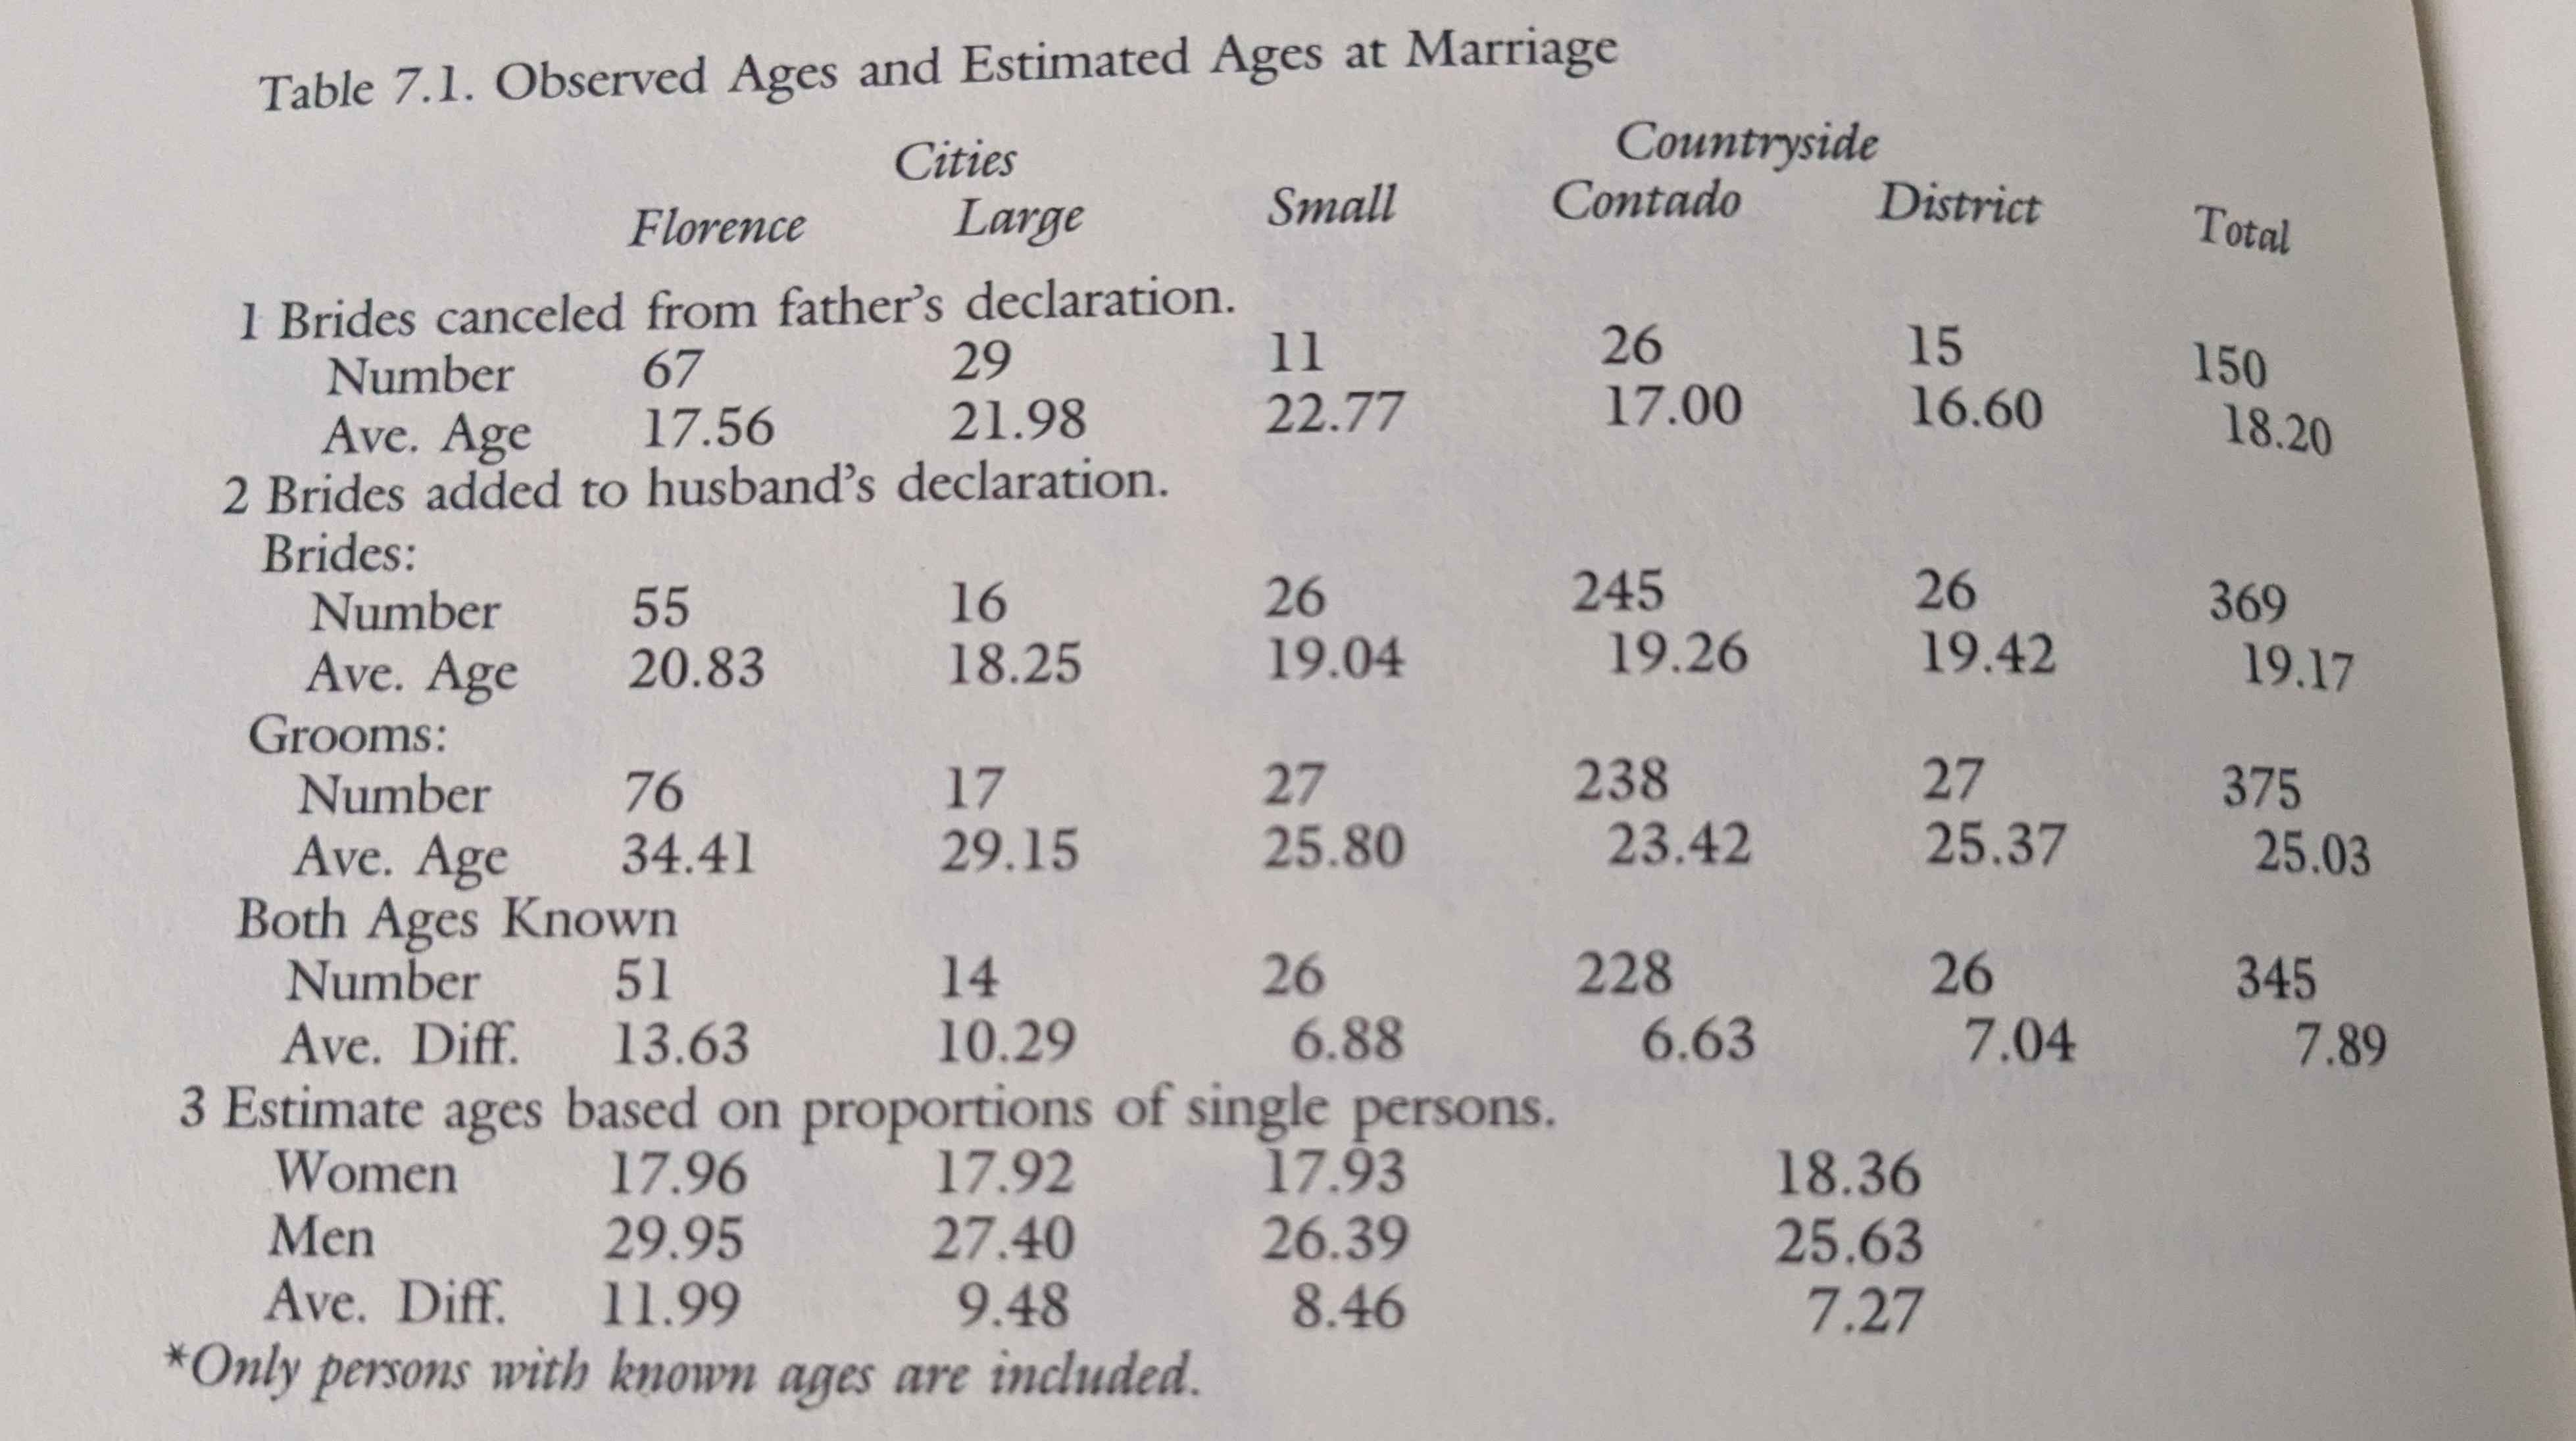
The method based off of corrections made by the family that the wife left leads to an average age of 18.2 at marriage. Interestingly, this method gives lower ages for the countryside than the cities, which is the opposite of what is suggested when the grooms’ families’ reports are used. The overall average, using this latter method, is 19.17 years. The last method shows estimates slightly below 18 for the three different urban categories, and one of 18.36 for rural areas in general. In conclusion, then, these three different ways of estimating the average age at marriage lead to mostly homogenous results—women in Tuscany, during the early 1400s, typically got married in their late teens.4
Herlihy & Klapisch-Zuber (1985) also provide estimates for Prato, another region of Tuscany, as well as for different years of Florence. These estimates are based on the proportion married among different age groups, which was the last method described above. In the city of Prato, the average age at marriage for girls was 16.3 in 1372, 17.6 in 1427, and 21.1 in 1470. In its countryside, the averages were 15.3, 17.3, and 19.5, respectively. For the city of Florence, the average age was 17.6 in 1427, 19.5 in 1458, and 20.8 in 1480. In the countryside of Florence, the only data available was for 1427 and 1470. In these years, the average ages of girls at marriage were 18.4 and 21, respectively (Table 3.10). During the span of a century in Prato, and over 40 years in Florence, there seems to have been a major increase in the average ages at which women married. In fourteenth century Prato, girls often married young, but that number must have been greatly reduced by the early fifteenth century.
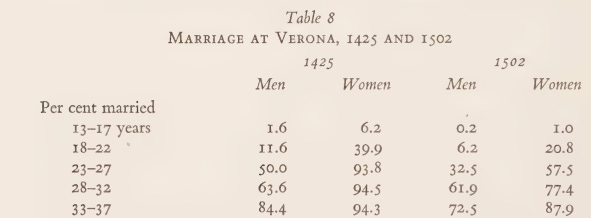
Herlihy (1974) also organized data from two censuses of Verona, then on of the largest Italian cities, for the years 1425 and 1502. In the former date, just under 40% of women in the age range of 18-22 were married, though almost all were married by the mid twenties. This suggests an average age at marriage of around 21-22. In 1502, marriage was even later, with only a fifth being married by ages 18-22 and less than two thirds by ages 23-27. Because marriage was not nearly as universal as it was in 1425, it is difficult to calculate the average; probably, it was somewhere in the region of 22-23 years.
Data is also available for another part of Italy. Namely, a study by David Rheubottom (1988) estimated marital ages of girls in fifteenth century Ragusa, a city in Sicily. Included in his study were betrothals from the ruling class that occurred between the years 1400 and 1520. Rheubottom began by calculating the average time between a man’s marriage, and the year of his first born daughter’s betrothal. He concluded that this interval was 22 years. Because betrothal was not instantaneously succeeded by marriage, he subtracted from this the average time between betrothal and its consummation of three years. This means that the average man with a female first born would have been married for 19 years when she was betrothed. Lastly, one year was accounted to be the time needed, on average, to beget a child. This final calculation means that the daughter was, on average, born eighteen years before her betrothal, implying an age of 18.0 at betrothal.5 If we add those same three years that the author allowed for the time between the man’s betrothal and his marriage—and, obviously, this time would be equally long for both sexes, as each betrothal and consummation involves the same number of people from both sexes, for whom it happens simultaneously—this means that the women were about 21 at marriage, on average. As mentioned in section 3.2, however, preindustrial data suggest that the time between first birth and marriage is somewhat longer than one year. If the length of 1.5 years is used, which was the slightly higher end of the range, then the age of the woman at marriage is lowered to 20.5.
Lastly, James Grubb (1996), in his study of a handful of elite Italian families during the late middle ages, provides data from which an average age at marriage can be calculated for the years 1425-1499, but with only a small sample of under two dozen girls. This average age is about twenty years (Appendix, Table 1.1), which is in line with the other estimates.
3.5. France
For medieval France, Not much evidence is available in English publications. Erasmus, an important figure in the proto-reformation, wrote that “[i]t isn’t rare to see, especially among the French, a girl hardly ten years old married, and a mother at 11” (quoted in Herlihy, 1985, p. 105). This appears to be a huge exaggeration. According to Lynch (2003, p. 45), “French data suggest that in medieval towns and cities, women generally married around age 20”. Being more specific, Laumonier (2020) writes (p. 11),
the Dijon, Burgundy, age at marriage for working-class women was at twenty to twenty-one years old in the late fifteenth century; similarly, in Gevaudan, most marriages occurred after women had reached twenty years of age.
The same author also notes that “women from Montpellier, who worked as servants or apprentices, may have married at around age twenty, give or take a few years” (p. 11), basing this on the fact that, in a sample of 8 contracts, the female servant was, on average, freed at age 16.75 (n. 130). Lastly, there is some fragmented evidence presented by Karras (2011, pp. 1030-1031) from fifteenth century Parisian courts:
In five cases, a woman’s age at marriage can be roughly calculated, typically with some assumptions, based on how the woman was identified in court records (e.g., married for x years, aged y years). Karras calculated a lower bound estimate of 17.25 and an upper bound of 20.75 years (fn. 89).
In ten cases, a woman’s age at (premarital) deflowerment is known. This can be an indicator for age at marriage because this was typically done under the intention of marrying soon after. The ten ages range from 16 to 25, with an average of 17.5 years.
Though this evidence seems to suggest a somewhat lower age at marriage, perhaps in the late teens instead of the early twenties, it should, of course, not be given as much weight as the other, more complete and representative data.
4. Early Modern and Victorian (1500-1900)
There is a lot of data for marriage age during this period. Therefore, I do not mention every study that I have found—only those which I believe are the best. Of course, I have only excluded studies when there were multiple for the same country, at a given period; I have included all countries for whom I found data, and covered each period when I was able to.
4.1. Age at Menarche
This is the only period here examined for which there are many quantitative examinations into age at menarche, typically based on women’s recollections. I have restricted this literature review to samples in which it can be ensured that all or most of the girls were born before 1880.
The data for the earliest period is provided by Laslett (1971), for the city of Belgrade, Serbia. This data comes from a census of 1,357 people, taken in 1733-34. Although age at menarche is not specifically mentioned in the document, Laslett calculated it as likely occurring slightly earlier than age 15 for the majority of girls, based on patterns of marriage and child birth. (The majority of girls were married by age 16, but pretty much none married before age 15. Furthermore, the average age at which a mother gave birth appeared to be just under 17, necessitating that the majority were able to conceive by about age 16.)
The next earliest sample comes from records of slaves from the U.S., 1807-64, some of which must have been born in the late eighteenth century. These records are of slaves domestically transported within the United States, presumably to be sold, and, therefore, may not have been fully representative of the slave population. Still, the data is worth considering. Using height data on these slaves, Trussell & Steckel (1978) identified a large spike in height at an average age of 13, presumably the beginning of puberty. To this, they added two years, “a conservative delay”, making the age at menarche 15. A more sophisticated way to analyze this data would be to use an equation developed by Brown (1966) based off of data from Nicolson & Hanley’s (1953) study of 83 girls born in California, in which the correlation between age at menarche and age upon reaching 90% of adult height was .861. The regression line is as follows (p. 13):
Age at menarche=1.076 x Age on reach 90 per cent. of mature height + 0.54 years.
Trussell & Steckel (1978) provided specific data on the heights of slaves aged eight to eighteen. Average height at age 18 was 62.7 inches, 90% of which equals 56.43; this most matches age 13’s average of 56.7. Applying the above equation to age 13 results in a menarcheal age of 14.53.
Next, there are several estimates given by Brown (1966). The first estimate is based on a sample of over 600 patients at a maternity hospital in Birmingham, England, collected in 1830-45. The average age at menarche was 15.3. Brown also reports data from a German publication, showing that the age at menarche in France varied from about 14.5 to 15.5 throughout the years 1830 to 1899. Lastly, Brown uses his equation to estimate age at menarche in girls based on Galton’s height data of Englishmen in the late 19th century. He concludes that 14.4 was the average age at first period.
There exist studies of the age at menarche in Norway going back to the middle of the nineteenth century. Several authors have used this data to describe large declines in menarcheal age over time, calculating a mean age of 17 at first period in the early 1800s, but this was based on a misinterpretation. Simply, menarcheal ages were given in the form of “nth year”, rather than “year n”, leading some to incorrectly classify, for example, “the 12th year” as being somewhere between ages 12 and 13, when, really, it refers to somewhere between ages 11 and 12. On the basis of reports published in the 19th century, Brundtland & Walløe (1976) found that, when correctly computed, the average age at first period was about 16 throughout the century. Later, Brudevoll et al. (1979) discovered that original data for a maternity clinic still survives as far back as the 19th century, in the city of Oslo, Norway. They find that working class women’s average age at menarche was roughly 15.5 and 14.5 for women born in 1840 and 1880, respectively. Among women of higher statuses, those born in 1870 and 1880 had their first periods around age 14.5. Lastly, Rosenberg (1991) reports similar data for those born between 1830 and 1880 in Oslo, with the mean age at menarche ranging from about 15 to a little over 16, and those born in Bergen (also in Norway) between 1850 and 1880, with the mean age at first period being between 15 and 15.5 during this period. The figures provided by Rosenberg are the ones which I put in the summary table.
There are also data for Switzerland. Lehmann & Scheffler (2016) examine age at menarche for various five year birth cohorts in Bern, Switzerland. I have used his data to calculate weighted averages (weighted for sample size) for those born in the years 1815-1849 and 1850-1879. The averages for these periods were 16.8 and 16 years, respectively. It should be noted that these authors classified menarcheal ages in the correct way (see their p. 3), so the very high age at first period is not an artifact of data assembly.
Lastly, Lehmann et al. (2010) present results from over 100 studies published in various countries over more than 150 years. Thankfully, there were several estimates for the 19th century that did not overlap with those which I found on my own, though all of these novel studies were inaccessible to me because they were published in languages other than English. Therefore, I included them in the table under the citation “Lehmann et al., 2010”.
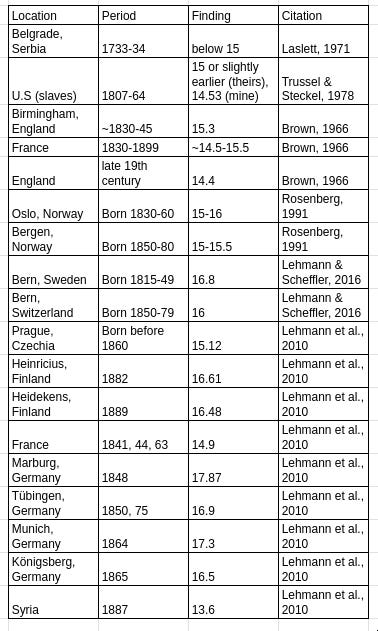
From this data, it can be seen that, during this period, girls typically began menstruating at an average of between 14 and 15.5 in Syria, Serbia, the U.S. (for slaves), England, France, and Czechia, but at ages 16-17 in parts of Norway, Switzerland, and Germany. However, all of these estimates, besides the first one, come from data collected after the Industrial Revolution. Therefore, when it comes to societies before 1800, these numbers will be reduced by one year. Women will be considered immature before age 16.5 in post 1800, non-Nordic countries, or age 18 in Nordic countries post 1800, and one year younger for each before 1800. This will apply unless menarche data is specifically available for that country at that time. Furthermore, women older than 19 or 20.5 for post-1800 non-Nordic and Nordic countries, respectively, and 18 and 19.5 before 1800, for the same countries, will be considered mature.
4.2. Belgium
To my knowledge, the best data regarding Belgium can be found in Michael Flinn’s (1981) collation (Appendix Table 7). For the period before 1750, Flinn knew of data for 10 parishes, with the weighted average for female age at marriage for these was 25 years. Between 1740 and 1790, the weighted mean, based on 11 parishes, was 24.8. Finally, for the period 1780-1820, there were only three parishes with available data, and these suggested an average of 27.9. More recently, Gutmann (1987) presented results for several more parishes:
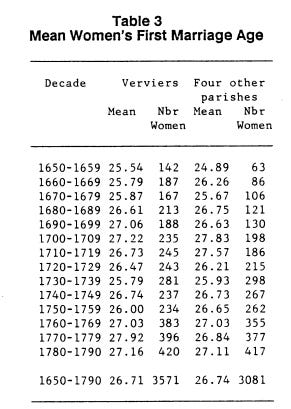
In the industrialized parish of Verviers, female age at marriage for the period 1650-1790 averaged to 26.71, while, for the other four parishes included in his study, that number was 26.74. Furthermore, Devos (1999, Appendix Table 3), citing a paper written in French, shows that female age at marriage in Flanders varied from 24.2 to 28.5 during the seventeenth, eighteenth, and nineteenth centuries.
4.3. Canada
Clark et al. (2024) analyzed data from a large database of marriages in Quebec between 1608 and 1828. While the first period, going up to 1650, had a very low female age at first marriage (15.5), all subsequent 50 year periods had ages in the low 20s. During the first period, the time between first birth and marriage was almost double what it was in the later periods (2.85 instead of approximately 1.5), which could imply either that the girls were not physically mature or that they waited longer than usual to consummate the marriage. Most likely, it means both. Although this implies immaturity at the time of marriage, the later periods have much larger samples, and there are more of them, so the overall average age for a woman to marry in Early Modern Quebec was in the low 20s. Nineteenth century estimates given by Gee (1982) range from 23 to 26 years between 1851-1891, slightly higher than in the seventeenth and eighteenth centuries.
4.4. China
In their book Faith and Fortune in Rural China, Lee & Campbell (1997) provide estimates of age at first marriage from well preserved registers. They found that, for those women born between 1774 and 1840, marriage came, on average, at an age of 19.78 sui (Table 5.3), equivalent to approximately 18.28 years old.6 Chen et al. (2014) provide data for Shuangcheng for 1870-1899, and calculate an average age at marriage for women of 20 sui, or 18.5 years (Table 11.1).
4.5. England
During this period, there is much literary evidence which could be, and has been, cited to support an early age at marriage. Shakespeare famously had Juliet be thirteen when her marriage was arranged (1.2.8-9, Mowat & Werstine ed., 2004)7; meanwhile, a book published in the late 16th century alleged the following in a discussion of marriage (Stubs, 1585, p. 55a):
[I]n Ailgna [that is, England] there is over greate libertie permitted therein: for little Infants in Swadling cloutes, are often maried by their ambicious parentes and freendes, when they know neither good nor evil, and this is the origene of much wickednes, and directly against the word of God, and examples of the primative age.
Outhwaite (1973) has summarized English data for some of the Modern Era. From the late 17th century to the beginning of the nineteenth, data are depicted in a table (pp. 60-61, fn. 24, at p. 61). From this data, it can be seen that the average age at marriage for women varied between years and locations in a narrow range—from a low of 22.3 years in Sussex during the years 1801-10, to a high of 25.5 for Suffolk in the middle of the eighteenth century.
For the 19th century, national data for the majority of years is available. Outhwaite (1973) summarizes it as follows (p. 58):
The series for both sexes show a remarkable small range of variation. The lowest figure we have for bachelors is that for 1839-41, 25.5 years, the highest figure that for 1899, 26.6; over the same period the average for spinsters rose only from 24.3 to 25.2 years. The earliest figures, however, were based on a very small sample, for in only about six percent of all marriages did both parties return their age. By 1867, however, the return had risen to two-thirds. In 1897 the Registrar General looking back in time found it difficult to reconcile the slight reported rises of under one-third of a year between 1839-41 and 1867 with the rising proportions of marriages of minors over the same period, and he argued that in reality a fall in the age at marriage had occurred. The small early sample, he suggested, was biased in the direction of the young, elderly couples being less likely to render their actual ages. If the earliest figures are too low, however, the real ones were unlikely to have been substantially above the 25.8 for males and 24.6 for females based on the 37 per cent return for the year 1851. Over half a century of profound structural change in both the economy and society appears, therefore, to have affected age at first marriage only slightly.
The data clearly show, then, that the average age at marriage for women during the 19th century, in England, was between 24 and 25. It should also be noted that, when data was based on just six percent of the population, it did not differ much from when it was based on over a third of all marriages. This weakens one of the arguments often made about early modern marriage data, which is that they often come from national or local marriage registries, in which the majority of marriages never appeared (e.g., Lelis et al., 2003, p. v). If a sample of 6 percent finds equivalent results to one of 37 percent, it is unlikely that increasing the percentage of marriages recorded would substantially change the estimated mean age at marriage.
Clark et al. (2024) used data on the ages at marriage of almost 48,000 Britons, from a database of all known Englishmen with certain rare surnames, whose families can be tracked over time. Clark and his colleagues’ study examined those born between 1650 and 1849. Average age at first marriage, for women, varied between periods. For those whose birth was between 1650 and 1699, it was 24; between 1700 and 1749, 24.6; between 1750 and 1799, 24.8; and, between 1800 and 1850, 25.
The best study of Early Modern English demography was published by Wrigley and colleagues (1997). Their estimates of the average age at marriage do not differ much by parish or by year, ranging from 23.2-26.4, with most of the parish-decade averages being between 25 and 26 (Table 5.1).
There is also some data pertaining specifically to elite Britons. Peter Laslett (2000, p. 82, Table 5) provides data on 118 brides from the gentry, and 716 noblewomen, all from the early to mid-17th century, whose ages at first marriage ranged from 19.39 to 21.75, depending on the group and the period.
4.6. Finland
Moring (1996) has analyzed records from several Finnish parishes in the eighteenth and nineteenth centuries. In the early 1700s, women married, on average, at approximately 21 and a half years old, but this increased to 25-27 for the rest of the period.
4.7. France
Besides England, France is probably the country with the highest quality data for this period. Bardet (2001, Appendix A) provides various estimates for different parts of France at different times:
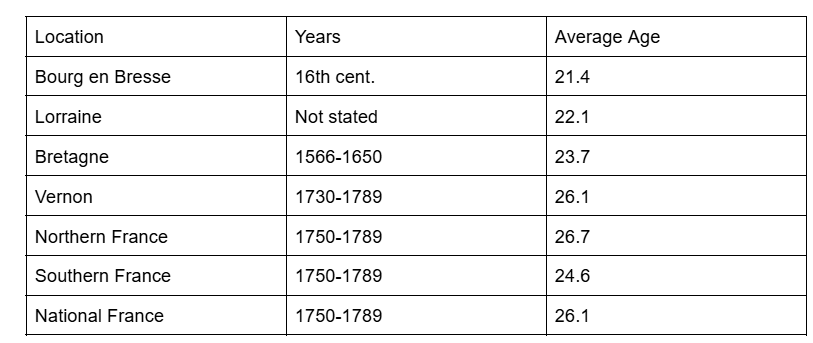
In most period-location categories, women married on average in their mid-20s and never earlier than the early-20s. Based on various registers, Bris & Tallec (2023) were able to estimate the average age at marriage in Montesquieu-Volvestre, between the years 1660 and 1789. The average age of women at marriage during this period was 24.35, varying from approximately 22 to 28 years at different times. There is also another, less direct, piece of evidence regarding marital ages for women in early modern France. An analysis of novels from the second half of the 1700s reveals that the average age that the female protagonists married at was 18.8 (Bardet, 2001, Table 1). Of course, this should be given less weight than the other evidence, which converges on an average age in the mid-20s. Also, data from Dijon court witnesses, from between 1500 and 1550, with a total sample size of 32 females, suggests an average age at marriage of 21.9 ( Rossiaud, 1988, p. 15)
Nineteenth century data shows similar averages to the eighteenth and seventeenth centuries. For example, Segalen (1991) found ages in the early to mid 20s in each of the five ten year periods in a small town in Northern France, between 1800 and 1850. Lynch’s (1986) estimates for a different French town were slightly higher, with averages ranging from 24.6 to 27.0 between 1824 and 1853.
4.8. Germany
Based on data from over a dozen villages, spanning the years 1700 to 1899, John Knodel (1988) calculated the average age of women at marriage at 26.1, with very little variation between villages or by time (Table 6.1). In fact, the youngest average age at marriage in any village, during any 50 year period, was 23.5 years. Knodel also provides data by socioeconomic status. The most useful results are for women marrying village leaders (Table 6.4), representing very high status, which indicate an average age at marriage of 24.1 years (compared to 26.2 for those marrying non-leaders).
4.9. Hungary
Peter Ori (2015) calculated the average age at marriage for women in a major Hungarian county for the 1770s. He found this age to be 20.4 years (Table 3).
4.10. Ireland
Joseph Lee (1968, p. 287) cites the 1841 census of Ireland as showing a median age at marriage for women of 22. Morgan & Macafee (1984), analyzing broader census data for the early to mid nineteenth century found averages ranging from the early to mid twenties. Luddy & O’Dowd (2020, pp. 92-93) cited an unpublished dissertation as showing an average age at marriage in the early twenties, ranging from 21.8 to 23.25, for eighteenth century Wicklow. Lastly, Kowaleski (1998, Table A2) cited several analyses of mid to late seventeenth century Ireland, with average ages at marriage ranging from 22.6 to 23.8. All of these estimates agree with an average in the early twenties.
4.11. Italy
Viazzo (2003) has summarized Italian data from the late middle ages to 1900, citing an essay written in Italian:
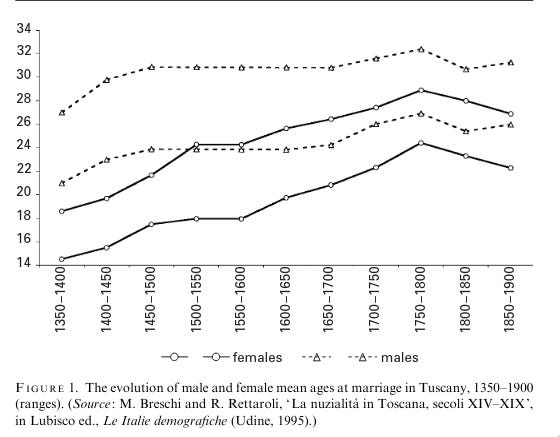
The numbers for 1350-1500 appear to all come from Herlihy & Klepisch-Zuber’s (1985) study of a Tuscan land registry, which was reviewed in section 3.5. Specifically, authors seem to have only used urban data. The lower bound estimates are the lowest figures found (e.g., from 1350-1400, the lower estimate matches up to the city of Prato’s age at marriage in 1372, which was 14.3) and the higher bound is the opposite (e.g., from 1450-1500, the higher estimates corresponds to one estimate of the average in large cities, which was 21.77). Although it is not clear how well lower and upper bound estimates reflect the average, it is probable that the average age of women at marriage increased from something like 20 during the period 1500-1550, to about 22 in 1600-1650. By 1700-1750, it was around 24, where it stayed through to the end of the final period, 1850-1900. These are my estimates based on placing a mark on what I thought was close to the average of the upper- and lower estimates, and then using a ruler to see what that corresponds to on the vertical axis. Crude as these estimates may be, they all converge on the average age being one’s early 20s during this 400 year period.
4.12. Japan
Hayami & Uchida (1972) provide data for various districts in one Japanese county, under different times, spanning from 1671 to 1870. All of the various averages never deviate by more than 2 year from 20, with the lowest being 18.3 and the highest being 22, with the (unweighted) mean being 20.32 years. Hayami (1987) also provides an estimate for later in the 19th century, this time for the whole of Japan. He estimates that, in 1899, the average age at marriage was 22.4 for women.
Unlike the above data, Noriko Tsuya and Satomi Korosu (2014) found very low ages for Shimomoriya and Niita, between the years 1716 and 1870 (Table 10.2), ranging from an average of 12.5 in 1716-1759 to 16.5 in 1840 to 1870. However, this appears to have only been true for that one part of Japan, as national data suggests totally different patterns of behavior.
4.13. The Netherlands
Moor & Zanden (2010) cite some Dutch evidence. Based on just ten women whose age at marriage is known, they estimate the average to be about 20-21 for “the countryside around Leiden” in 1540-41 (p. 16). For women living in Amsterdam in the 1580s and ‘90s, the average age at marriage was “between 23.5 and 25 years, and it remained at this level until the 1660s, when it started to rise even further” (p. 17). More extensive data is provided by Charlotte Stormer and colleagues (2018), who use two databases—marriage records kept in Amsterdam, and crowd sourced genealogies, which gave them a total sample size of just over 185,000 marriages, though not all of these were first marriages. Of those marrying for the first time, in the genealogical data, the average Dutch woman was approximately 24 years old in the period 1650-1699, and almost 26 in 1850-1899. In the Amsterdam data, the average bride was 26 in 1650, but closer to 27.5 in the rest of the period.
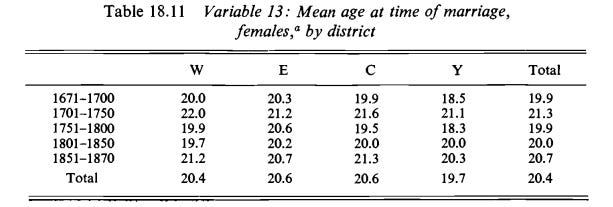
4.14. Poland
There is a long literature on Early Modern female ages at marriage in Poland. These data have been summarized by Piotr Guzowski (2013). The following table presents the bulk of it:
In all nine towns, spanning the time of 1740-1815, the female age at marriage was never below 20. Guzowski described several estimates for earlier time periods (pp. 12-13):
In Toruń, the age at which women were married increased during the seventeenth century from 19.5 to 24.5, on average. In the seventeenth century, in the Warsaw parish of St John, the average age of women entering marriage was 20.1…In the second half of the eighteenth century, women in the parish of Holy Cross married at 21.8…
Therefore, estimates for many locations in Poland, from the 17th to the early 19th century, suggest an average age of women at marriage in the early 20s, although the data for older times indicate slightly lower ages at marriage, of around 20 years old.
4.15. Portugal
The evidence for Early Modern Portugal is given by Kowaleski (1998, Table A2). She cites data for two villages; in one, only data for the year 1545 is available, which showed an average female age at marriage of 21.6. The other village, for which data is available from 1610-1629 and 1721-1800, for which periods the average woman’s ages at marriage were 25.3 and 26.4 years, respectively.
4.16. Russia
A few studies of early modern and Victorian Russian demography, as it pertains to age at marriage, have been conducted, though typically in reference to the serf population. Peter Czap (1982) examined several censuses taken between 1782 and 1858, in reference to a large estate where, during this period, resided between 12 and 15 hundred serfs. Over the eight enumerations for which age at marriage could be calculated, the average age at marriage for women ranged from 16.6 to 19, with an unweighted mean of 18.30 years. Next, Hoch (1986) examined similar data for the serf population of a rural village, for the years 1813-56. In the three period-groups which he examined from this time, the female mean age at marriage ranged from 18.4 to 19.5, and the average for all 43 years (weighted for sample size) was 18.93 (Table 17). Lastly for serf demography, Dennison (2011) calculated the age at marriage to have ranged from 18.3 to 22 for women, between 1816 and 1858, in another rural village (Table 3.9). The unweighted mean was 20.15. These three studies converge on about the same age range, and support a relatively early—but not too early—age at marriage.
As for the general population of all of Russia, Mironov (2017, Table 2) provides data for 1867 and 1910, exclusive of the Asiatic part of Russia; in the former year, the average age for women at marriage was 21.5, with no significant rural-urban difference, while, in 1910, it was 21.9 for Russia as a whole, and 21.6 and 23.7 for rural and urban areas, respectively. Kaiser (2003, p. 302), citing a book that he himself had written, but which I could not obtain a copy of, wrote, “women of this era only married in their late teens and early twenties”, according to “the only firm data we have on age at marriage”. Evidence from the general population, then, shows slightly higher ages at marriage than for serfs, but still within roughly the same range.
4.17. Scotland
R. A. Houston (1990) provides data from the years 1660 to 1770, based on ages and marital statuses of women appearing before the High Court of Justiciary. Based on this data, he concludes that the average age at marriage “was of the order of 26 or 27” (p. 66). Additionally, Kowaleski (1998, Table A2) gives averages of 23.5 and 26.5 for the rural and urban parts of Kilmarnock, respectively, both for the middle of the eighteenth century.
4.18. Serbia
As mentioned in the Menarche section, Peter Laslett (1971) examined data on marriage for Belgrade, for the years 1773-74. In the records he examined, the median age at marriage was about sixteen for girls, with about a third being married by fifteen and almost none before then. Half a year must be added to this number, making the median age about 16.5 years. This puts Serbia into borderline territory, and this is especially justified because the data comes from a small, Orthodox community which may not have been representative of the country as a whole. Furthermore, age at menarche for Serbia comes partially from Laslett’s analysis of marriage and birth data, making an estimate of age at maturity somewhat circular; however, Serbia’s category is the same even when it is based on other societies’ estimates for this period, as outlined above.
4.19. Spain
Data for Spain is summarized by Kowaleski (1998, Table A2). I have adapted her data into the table below:
It can be seen that the average marital age for women at any location-period cell was never below 20, aside from one village in the late sixteenth century, and another city in the 17th century, in which cases it dropped down to 19.6. Nineteenth century data, not provided by Kowaleski, also shows marriage occurring in the early twenties (Reher, 1991; Marfany, 2006).
4.20. Switzerland
Data from sixteenth century Geneva was cited by Kowaleski (1998, Table A2). She gave the average for 1625-44 as 24.8 years and, for 1650-74, as 26 years. The only additional data I have been able to find come from a study of marriages registered in the nineteenth century for the city of Lucerne, which suggests an average age at marriage of 27 for women (Seiler, 2018, n. 1). All three of these data points correspond to the mid twenties.
4.21. Dutch South Africa
Leonard Guelke (1988) provides data from two censuses taken of the colony of Cape Town, then controlled by the Dutch. Of those women who were married in 1705, the average age at marriage was just 17.2, while the age in 1731 was 18.5. Weighted for population size, the average of these two samples is 18.18 years. Ross (1975), on the other hand, reported a mean age of 21 for women at marriage, and a median age of 19.6, based on 279 marriages for which the bride’s age could be calculated, in the eighteenth century. Finally, based on a large genealogical database, Jeanne Cilliars (2013) found an average age at marriage of 27.24, and a median of 24.53, combined over three periods between 1700 and 1849 (weighted averages, calculated from Table 9). He writes (p. 46):
Mean estimates in this sample appear to overestimate age at first marriage for women, particularly in the earliest period where the sample size is very small and is easily biased by outliers. The median age at first marriage is perhaps a better indicator of the actual figure as it is less subject to interference of outliers, although the general trend in age at first marriage which is of most interest can be seen clearly with either measure. For women then, the median age at first marriage of 20.5 in the earliest period (1700-1749) is perfectly in line with both Ross’s median estimate of 19.6 and mean estimate of 21.0 for women born around 1730 and slightly higher than Guelke’s estimate of 18.5 for all districts in 1731.
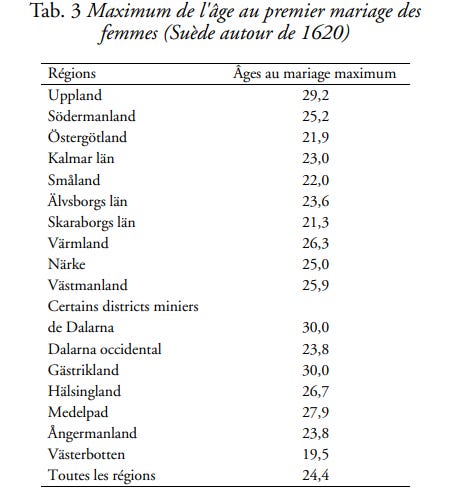
4.22. Sweden
Rotering & Bras (2019) provide data from 19th century parish records in Northern and Central Sweden. For marriages in which the wives were born between 1840 and 1889, they found that the average age at first marriage was 24.9 years (Table 1). National data for all of Sweden was examined by Rollin Chambliss (1957), who reported a median age at first marriage for women of 25.7 between the years 1881 and 1890, and 25.6 for the period 1891-1900.
Furthermore, a French article (Palm, 2001)8 which I was able to interpret with the aid of its tables, the English abstract, and common sense, provides data going back to the eighteenth and seventeenth centuries.
As far back as 1751-55, the average female age at marriage was over 25 years, and, for the rest of the eighteenth and nineteenth centuries, it varied from about 25.5 to 26.5 for Sweden as a whole. Next, the maximum women’s ages at marriage for various parishes in the early 17th century are calculated. In the English Abstract, they write, “after some adjustments, it would be found that the age of women at first marriage must have been maximum 24 years, which certainly places them around 20”. In other words, the author believes that the best estimate of the average female age at marriage is probably about 20 for the early 17th century.
4.23. Turkey
Alan Dubin (1990) provides several datapoints for late 19th century Istanbul. In 1885, the average female age at marriage was 19. Soon after the turn of the century, in 1907, the average had apparently gone up, and women on average married “around 20”. Duben also guessed about the age at marriage in rural Turkey, hypothesizing that it “occurred between 14 and 18” (p. 423) for girls, though without evidence of any kind. The exact figures for Istanbul are given in a later publication by Dubin (& Behar, 1991, Table 5.1) as 19.1 and 20.5 years.
4.24. United States
Adam Smith wrote in his The Wealth of Nations (1776) that Americans were much more fertile than Europeans (Bk. III, ch. 4: Cannan, 2003 ed.):
Through the greater part of Europe, the number of inhabitants is not supposed to double in less than five hundred years. In several of our North American colonies, it is found to double in twenty or five-and-twenty years.
Michael Haines (1996, pp. 16-17) cites several eighteenth and early nineteenth century authors (though he does not mention Smith) to this same effect—Americans were much more fertile than Europeans. The authors whom he cites attribute this to earlier marriage in colonial and early republican America.
Haines (1996) has himself summarized data from different parts of many states, ranging from the early 1600s to today, on the average age at which men and women married. For the purpose of this post, only the data for women up to 1900 is relevant. His table 1, far too long to be pictured here, summarizes data from about 1610 to the late 1700s. In pursuit of a summary, I will state the following:
The lowest mean age at marriage for women was 16.8, being the average for Maryland during the years 1650-1700.
The highest mean age at marriage for women was 25.5, being the average for Northampton, Massachusetts during the years 1750-1799.
The average for before the beginning of the eighteenth century was 19.8 years. During the early eighteenth century, the mean age was 21.2. Lastly, for the late eighteenth century, the average was 22.7
During the entire period, the average for New England was 22.3, whereas it was 20.3 in the rest of the states studied.
Also provided by Haines (1996) are data on the estimated age at first marriage, based on Hajnal’s (1953) method. During this period, the female age at first marriage varies from just under 19.5 to a little under 23. The estimates are shown below. Lastly, Haines presents estimates for mid 19th century New York, as well as Census based measures for the U.S. as a whole, for the year 1880 upward. For New York, data was available for seven counties, averaging 23.7 years, varying at the county level in only a very small range, from 22.2 to 24.8. For America as a whole, the average age of a woman at marriage was 23.08, 23.61, and 23.65 for the years 1880, ‘90, and 1900, respectively.
There is also evidence for slaves specifically. According to Trussell & Steckel (1978, p. 492), the average slave gave birth at approximately 20.6 years old. If 1.25-1.50 years are subtracted from this number (approximately the average distance between marriage and childbirth in the early modern period; see above), then the average female slave married at age 19-9.35. Additionally, Logan & Pritchett (2018) examined records from a New Orleans hospital, near the end of slavery. They estimated that the average enslaved woman married at age 25.8 (Table 3). Lastly, Crawford (1992) provides data taken from interviews given to ex slaves in the 1930s, about their life before abolition. Of the slaves who described their living situation, not many were married and living in their own house. While there were no ages at which the majority of female slaves reported being married and living separately from the rest of their family, the number who fit into that category increased between 16-19 and 20-25, and again to a lesser extent in the category of 25+, suggesting that the early to mid-20s was probably the most common time for slave girls to marry.
5. Conclusion
5.1. Summary
The table below summarizes all of the data described above. Of 38 societies analyzed, only 2 were ones in which the average woman likely married before completing puberty: both with average ages just under 15, and both being placed in the ancient period. One society, 18th century Serbia, was placed in the borderline category, meaning that there is insufficient evidence that the girls were either mature or immature (see above). Removing that datapoint, only just over 5% of societies I examined practiced child marriage (defined as marriage before maturity) as the norm, and that figure is 0% for societies in the Medieval and Early Modern periods. Consider also that the only European or European descended society where the average bride was deemed by me to probably be immature was the Ancient Roman elite, which was notoriously degenerate.9 It is also possible that elite Roman girls matured quicker, and that they really were mature by the time of their marriage.
It should be said that there is some evidence that women historically underestimated their ages in a way that would lead to underestimates of age at marriage. The best study of this behavior before the modern period compared women’s ages in the Catasto to what their ages should have been based on dowry funds which were usually started at around age 4 or 5, and which noted their age at the time. The study found that women who were really 20-25 reported being the correct age about 4% of the time, and a lower age over 92% of the time. Similarly, women aged 16-19 reported being the correct age only 14% of the time and, in 81% of cases, a younger age. In the younger age groups, it was also more common for a woman to state an age too low than one too high, but the portion of incorrectly stated ages was much lower (Molho, 1988, Table 2). To get an idea of the extent to which this can bias estimates, I used data from that study to estimate how much this decreased the average age at marriage in Florence (see Appendix). My conservative estimate is that it biased the average age at marriage downward by a 1.6 years. But, like the other downward bias which I have noted, namely that the average person stated to be of age x is actually half a year older than x, can only apply to estimates based off of declared ages, which are a small minority of the sample.10
5.2. Implications
Recently, Joseph Bronski (Substack link) started a debate on X/Twitter over the topic of what the age of consent should be by pretending to be married to a fifteen year old (he lives in France, where that would be legal). He argued that those who defended an age of consent of 18 were stupid proles, while his opponents argued that he should kill himself. Because American girls, on average, complete puberty at age 14.1 (German et al., 2015), I agree that an age of consent of 18 makes little sense. Almost nothing changes after that age, either physiologically or psychologically.11 The most obvious example of the insanity surrounding the age of consent debate is pedophile sting operation shows, the most popular of which was Chris Hansen’s To Catch a Predator. From my understanding, these shows get women in their late teens and early twenties to volunteer as “decoys”, pictures of whom are sent under the fake identity of a 13 or 14 year old girl to old men in order to entice them. In other words, then, the goal of these productions is to catch pedophiles who are sexually attracted to little girls that look like twenty year-olds.
Either way, long waits between puberty and marriage seem to be a relatively old part of U.S. culture. A Gallup poll from 1937 asked Americans, “If a girl has her parents’ consent to marry, how old should she be before the state permits the marriage?” Even then, the majority (53%) chose eighteen, and 25% chose an even higher age. Similar results were found from a 2022 YouGov survey, in which, once “not sure” responses are removed, it was found that 61% of Americans want “the minimum legal age for marriage without parental consent” to be eighteen years, and 25% wanted it to be higher. And this seems to have been the case in most societies before 1900 as well: the average age at marriage was rarely fewer than three years above what I estimated to be the age at maturity, which itself was probably an overestimate in most societies. Today’s average marriage age of 28.6 for women is only a few years higher than the most common type of Early Modern or Victorian society, where the average marriage age was in the mid twenties (about 1/3 of all societies in that category). What makes America so different from the past is not the age at marriage itself, but how much time passes between it and maturity—15 years.
Appendix: Downward Bias in Medieval Tuscany
Molho (1988) calculated a girl’s true age by adding the time which passed between her dowry fund was started and her registration in the Catasto to her age when her dowry fund began. He provides information as to how frequently their ages in the Catasto were off by a given amount in a specific direction, and disaggregated this data by true age, from 5 to 25 years (Table 1). The error categories were 0 (i.e., age perfectly matches), -1, -2, -3 or more (i.e., age is too low on the census), and +1 and +2 or more (i.e., age is too high on the census). I combined this information with the distribution of ages at marriage given by Herlihy & Klapisch-Zuber for urban Tuscany (1985, Figure 7.1).
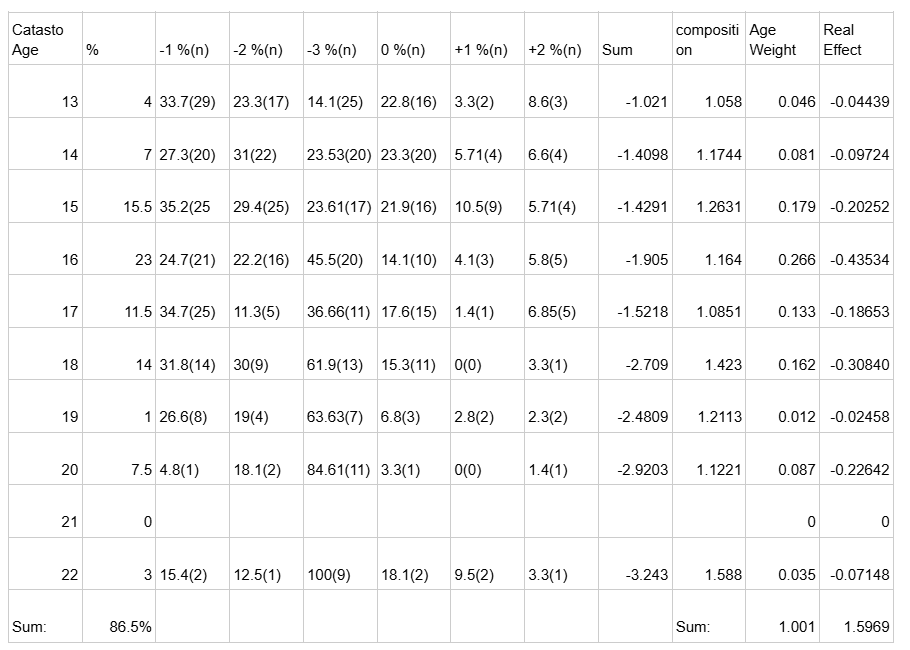
In the above table, the first column lists women’s ages at marriage, and the column next to it states what percentage of the marriages were made up of girls that age (rounded to the nearest 0.5%, because they were estimated from a bar chart). The next several columns show what percentage (sample size) of girls one year older, two years older, three or more years older, the same age, one year younger, and two or more years younger, respectively, listed their age as the one listed in that row, for the first column. For example, for the first row, in which the declared age is 13, the column -1 %(n) shows that 33.7%(n=29) of fourteen year-olds listed themselves as being thirteen, while the column +1 %(n) indicates that 3.3%(n=3) of 12 year-olds claimed to be thirteen. Note that the columns -3 %(n) and +2 %(n) also include those underestimating their age by more than 3 years and those overestimating them by more than 2 years. This is a limitation that I could not overcome because of the nature of Molho’s data presentation,12 and it probably leads to a considerable underestimation of the downward bias from this phenomenon. The next column is the sum of all of the columns just discussed (-1 through to +2) weighted by the + or - errors that they are attached to, while the one after it is simply the sum of the percentages, unweighted. After that is the column which indicates the weight of that row, as dictated by the percentage of marriages which featured a bride of the age shown in the first column, divided by the total percentage of marriages in which the bride was between the ages of 13 to 22 (86.5% of all marriages, as shown in the table). The reason that marriages with wives older than 22 were not used here is because Molho’s data only went up to the age of 25, and 22 is therefore the oldest age for which the column -3 %(n) could be calculated. Finally, the right-most column represents that row’s contribution to the distortion of the average marriage age in this sample of ages (i.e., 13-22), calculated by dividing the Sum column by the Composition column, and multiplying that quotient by the age weight.
The total distortion is the sum of the cells in this column, which, in this case, is about 1.6 years downward. Note that this method assumes that all ages, 11 through 25, were equally numerous, which should be roughly true in a population with a long term growth rate of ~0, low or moderate mortality rates after infanthood and very early childhood, and low in- and out-migration rates. This will lead to a slight overestimate of the downward bias of this effect, but the effect is still greatly underestimated because of the cutoff at age 22 and because the -3 category also includes cases where age is distorted by a greater magnitude than -3. Also note that the sample sizes given in parentheses are completely irrelevant; I only included them for the sake of transparency, in that the sample sizes are sometimes too low to put much trust in every individual cell of the table. As a final statement, I wish to express that I would not be surprised if the real downward bias was actually by three of more years, and so 1.6 is a very conservative estimate.
Update: HBD blogger Uncorrelated was kind enough to produce some visuals for the post. For the first one, it is clear that there has been an upward trend over time in the female marriage age:

And here is the regional breakdown of the trend over time:

Note from Alden:

References
Amundsen, D. & Diers, C., (1969). The Age of Menarche in Classical Greece and Rome. Human Biology, 41: 1, 125-32.
Amundsen, D. & Diers, C., (1973). The Age of Menarche in Medieval Europe. Human Biology, 45(3), 363-369.
Anderson, S. & Must, A. (2005). Interpreting the Continued Decline in the Average Age at Menarche: Results from Two Nationally Representative Surveys of U.S. Girls Studied 10 Years Apart. The Journal of Pediatrics, 147(6), 753-760.
Baber, R. (1934). Marriage in Ancient China. The Journal of Educational Sociology, 8(3), 131-140.
Bagnall, R. & Frier, B. (1994). The Demography of Roman Egypt. Cambridge University Press.
Bardet, J. (2001). Early Marriage in Pre-Modern France. The History of the Family, 6(3), 345-363.
Biro, F., Pajak, A., Wolff, M., Pinney, S., Windham, G., Galvez, M., Greenspan, L., Kushi, L., & Teitelbaum, S. (2018). Age of Menarche in a Longitudinal US Cohort. Journal of Pediatric Adolescent Gynecology, 31(4), 339-345.
Bris, D. & Tallec, R. (2023). The European Marriage Pattern and the Sensitivity of Female Age at Marriage to Economic Context, Montesquieu-Volvestre, 1660-1789. Cliometrica, 17(2), 187-231.
Brix, N., Ernst, A., Lauridsen, L. L. B., Parner, E., Støvring, H., Olsen, J., Henriksen, T. B., & Ramlau‐Hansen, C. H. (2018). Timing of puberty in boys and girls: A population‐based study. Paediatric and Perinatal Epidemiology, 33(1), 70–78.
Bronski, J. (2021). An Empirical Introduction to Youth: Revealing the Maturity of Young People and Why the Mainstream Gets It Wrong. Independently Published.
Brown, P., (1966). The Age at Menarche. British Journal of Preventive and Social Medicine, 20: 9-14.
Brudevoll, J., Liestøl, K., & Walløe, L., (1979). Menarcheal age in Oslo during the last 140 years. Annals of Human Biology, 6: 5, 407-416.
Brundtland, G. & Walløe, L., (1976). Menarcheal age in Norway in the 19th century: A re-evaluation of the historical sources. Annals of Human Biology, 3: 4, 363-374.
Bruserud, I., Roelants, M., Oehme, N., Madsen, A,. Eide, G., Bjerknes, R., Rosendahl, K., & Juliusson, P. (2020). References for Ultrasound Staging of Breast Maturation, Tanner Breast Staging, Pubic Hair, and Menarche in Norwegian Girls. Journal of Clinical Endocrinology & Metabolism, 105(5), 1599-1607.
Cameron, N., Grieve, C., & Leschner, K. (1993). Secondary sexual development in rural and urban South African black children. Annals of Human Biology, 20(6), 583-593.
Cannan, E., (2003). The Wealth of Nations. Random House.
Chambliss, R. (1957). Median Age at First Marriage in Sweden, 1881-1953. The Milbank Memorial Fund Quarterly, 35(3), 280-286.
Chen, S., Campbell, C., & Lee, J. (2014). Categorical Inequality and Gender Difference: Marriage and Remarriage in Northeast China, 1749-1913, in C. Lundh, S. Kurosu, et al. (Eds.) Similarity in Difference: Marriage in Europe and Asia, 1700-1900 (pp. 393-436). MIT Press.
Cilliars, J. (2013). Cape Colony Marriage in Perspective. Stellenbosch University (Thesis).
Clark, G. (2007). A Farewell to Alms: A Brief Economic History of the World. Princeton University Press.
Clark, G., Cummins, N., & Curtis, M., (2024). How did the European Marriage Pattern Persist? Social Versus Familial Inheritance: England and Quebec, 1650-1850. Economics and Human Biology, 54: 101383.
Crawford, S. (1992). The Slave Family: A View from the Slave Narratives, in C. Goldin & H. Rockoff (Eds.) Strategic Factors in Nineteenth Century American Economic History: A Volume in Honor of Robert W. Fogel (pp. 331-350). University of Chicago Press.
Czap, P. (1982). The Perennial Multiple Family Household, Mishino, Russia 1782-1858. Journal of Family History, 7(1), 5-26.
Datta, B. & Gupta, D. (1981). The Age at Menarche in Classical India. Annals of Human Biology, 8(4), 351-359.
Dennison, T. (2011). The Institutional Framework of Russian Serfdom. Cambridge University Press.
Devos, I. (1999). Marriage and Economic Conditions Since 1700: The Belgian Case, in I. Devos & L. Kennedy (Eds.) Marriage and Rural Economy: Western Europe Since 1400 (pp. 101-132). Brepols Publishers.
DeWitte, S. & Lewis, M. (2021). Medieval menarche: Changes in pubertal timing before and after the Black Death. American Journal of Human Biology, 33, e23439.
Dóber, I. & Királyfalvi, L., (1993). Pubertal Development in South Hungarian Boys and Girls. Annals of Human Biology, 20(1), 71-74.
Dubin, A. (1990). Household Formation in Late Ottoman Istanbul. International Journal of Middle East Studies, 22(4), 419-435.
Dubin, A. & Behar, C. (1991). Istanbul Households: Marriage, Family, and Fertility, 1880-1940. Cambridge University Press.
Engelhardt, L., Willers, B., & Pelz, L., (1995). Sexual Maturation in East German Girls. Acta Paediatrica, 84(12), 1362-1365.
Evans, L. (1857). The Satires of Juvenal, Persius, Sulpicia, and Lucilius. Published by Henry G. Bohn.
Figueredo, A., Hertler, S., & Penaherrera-Aguirre, M. (2020). Expansion, Fission, and Decline: England and Anglo America, in S. Hertler et al. (Eds.) Multileval Selection: Theoretical Foundations, Historical Examples, and Empirical Evidence (pp. 321-346). Palgrave Macmillan.
Flinn, M. (1981). The European Demographic System, 1500-1820. Johns Hopkins University Press.
Gee, E. (1982). Marriage in Nineteenth-Century Canada. Canadian Review of Sociology.
German, A., Shmoish, M., & Hochberg, Z., (2015). Predicting pubertal development by infantile and childhood height, BMI, and adiposity rebound. Pediatric Research, 78(4), 445-450.
Goldberg, P. (1992). Women, work, and life cycle in a Medieval economy: women in York and Yorkshire c.1300-1520. Oxford University Press.
Golding, J., Iles-Caven, Y., Northstone, K., Fraser, A., & Heron, J. (2024). Measure of puberty in the Avon Longitudinal Study of Parents and Children (ALPAC) offspring cohort. Wellcome Open Research, 8: 453.
Greil, H. & Kahl, H. (2005). Assessments of developmental age: cross-sectional analysis of secondary sexual characteristics. Anthropologischer Anzeiger, 63(1), 63-75.
Grubb, J. (1996). Provincial Families of the Renaissance: Private and Public Life of the Veneto. Johns Hopkins University Press.
Gutmann, M. (1987). Protoindustrialization and Marriage Ages in Eastern Belgium. Annales de Demographie Historique, 1987, 143-173.
Guelke, L. (1988). The Anatomy of a Colonial Settler Population: Cape Colony, 1657-1750. The International Journal of African Historical Studies, 21(3), 453-473.
Guzowski, P., (2013). The Origins of the European Marriage Pattern in Early Modern from the Perspective of Polish History. Acta Poloniae Historica, 108: 5-44.
Haines, M., (1996). Long-Term Marriage Patterns in the United States From Colonial Times to the Present. The History of the Family, 1: 1, 15-39.
Hajnal, J. (1953). Age at Marriage Proportion Marrying. Population Studies, 7(2), 111-136.
Hajnal, J. (1965). European Marriage Patterns in Perspective, in D. Glass & D. Eversley (Eds.) Population in History: Essays in Historical Demography, Volume 1 (pp. 101-143). Aldine Publishing Company.
Hallam, H., (1985). Age at First Marriage and Age at Death in Lincolnshire Fenland, 1252-1478. Population Studies, 39: 1, 55-69.
Hayami, A. & Uchida, N. (1972). Size of Household in a Japanese County Throughout the the Tokugawa Era, in P. Laslett & R. Wall (Ed.) Household and Family in Past Time (pp. 473-515). Cambridge University Press.
Hayami, A. (1987). Another Fossa Magna: Proportion Marrying and Age at Marriage in Late-Nineteenth Century Japan. Journal of Family History, 12(1-3), 57-72.
Herlihy, D. (1974). The Population of Verona in the First Century of Venetian Rule, in J. Hale (Ed.) Renaissance Venice (pp. 91-120). Faber and Faber.
Herlihy, D., (1985). Medieval Households. Harvard University Press.
Hardily, D., & Klapisch-Zuber, C., (1985). Tuscans and Their Families: A Study of the Florentine Catasto of 1427. Yale University Press.
Hoch, S. (1986). Serfdom and Social Control in Russia: Petrovskoe, a Village in Tambov. University of Chicago Press.
Hopkins, M., (1965). The Age of Roman Girls at Marriage. Population Studies, 18: 3, 309-327.
Houston, R. (1990). Age at Marriage of Scottish Women, Circa 1660-1770. Local Population Studies, 43, 63-66.
Hoyt, D. & Schatten, K., (1997). The Role of the Sun in Climate Change. Oxford University Press.
Ingalls, W., (2001). Παιδα Νεαν Μαλιϲτα: When Did Athenian Girls Really Marry?. Mouseion: Journal of the Classical Association of Canada, 1: 1, 17-29.
Juul, A., Teilmann, G., Scheike, T., Hertel, N., Holm, K., Laursen, E., Main, K., Skakkebaek, N. (2006). Pubertal development in Danish children: comparison of recent European and US data. International Journal of Andrology, 29(1), 247-255.
Kaiser, D. (2003). “Whose Wife Shall She Be at the Resurrection?”: Marriage and Remarriage in Early Modern Russia. Slavic Review, 62(2), 302-323.
Karras, R. (2011). The Regulation of Sexuality in the Late Middle Ages: England and France. Speculum, 86(4), 1010-1039.
Knodel, J. (1988). Demographic Behavior in the Past: A Study of Fourteenth German Village Populations in the Eighteenth and Nineteenth Centuries. Cambridge University Press. J.
Kowaleski, M. (1998). Appendix: Demographic Tables, in Bennett & A. Froide (Eds.) Singlewomen in the European Past, 1250-1800 (pp. 325-344). University of Pennsylvania Press.
Laslett, P., (1971). Age at Menarche in Europe since the Eighteenth Century. The Journal of Interdisciplinary History, 2: 2, 221-236.
Laslett, P. (2000). The World We Have Lost: Further Explored. Routledge.
Laumonier, L. (2020). Childless Families in Languedoc in the Fourteenth and Fifteenth Centuries. Journal of Family History, 45(4), 359-393.
Lee, J. (1968). Marriage and Population in Pre-Famine Ireland. The Economic History Review, 21(2), 283-295.
Lee, J. & Campbell, C. (1997). Fate and Fortune in Rural China: Social Organization and Population Behavior in Liaoning, 1774-1873. Cambridge University Press.lee
Lehmann, A., Scheffler, C., & Hermanussen, M., (2010). The Variation in Age at Menarche: An Indicator of Historic Developmental Tempo. Anthropologischer Anzeiger, 68: 1, 85-99.
Lehmann, A. & Scheffler, C., (2016). What Does the Mean Menarcheal Age Mean?—An Analysis of Temporal Pattern in Variability in a Historical Swiss Population from the 19th and 20th Centuries. American Journal of Human Biology, 28: 5, 705-713.
Lelis, A., Percy, W., & Verstraete, B., (2003). The Age of Marriage in Ancient Rome. Edwin Mellen Press.
Lewis, M., Shapland, F., & Watts, R. (2016a). On the threshold of adulthood: A new approach for the use of maturation indicators to assess puberty in adolescents from medieval England. American Journal of Human Biology, 28(1), 48-56.
Lewis, M., Shapland, F., & Watts, R. (2016b). The Influence of Chronic Conditions and the Environment on Pubertal Development: An Example from Medieval England. International Journal of Paleopathology, 12, 1-10.
Logan, T. & Pritchett, J. (2018). On the Marital Status of U.S. Slaves: Evidence from Touro Infirmary, New Orleans, Louisiana. Explorations in Economic History, 69, 50-63.
Luddy, M. & O’Dowd, M. (2020). Marriage in Ireland, 1660-1925. Cambridge University Press.
Lynch, K. (1986). Marriage Age Among French Factory Workers: An Alsatian Example. The Journal of Interdisciplinary History, 16(3), 405-429.
Lynch, K. (2003). Individuals, Families, and Communities in Europe, 1200-1800: The Urban Foundations of Western Society. Cambridge University Press.
Malamitsi-Puchner, A. & Konstantakos, I. (2023). Evidence, Hints and Assumptions for Late Pregnancy in the Ancient Mediterranean and Near East. Acta Paediatrica, 112(7), 1371-1377.
Marfany, J. (2006). Choices and Constraints: Marriage and Inheritance in Eighteenth- and Early-Nineteenth-Century Catalonia. Continuity and Change, 21(1), 73-106.
Martí-Henneberg, C. & Vizmanos, B. (1997). The duration of puberty in girls is related to the timing of its onset. The Journal of Pediatrics, 131(4), 618-621.
Mason, K. & Cope, L. (1987). Sources of Age and Date-of-Birth Misreporting in the 1900 U.S. Census. Demography, 24(4), 563-573.
Medvei, V. (1982). A History of Endocrinology. MTP Press.
Moffitt, T., Caspi, A., Belsky, J., & Silva, P., (1992). Childhood Experiences and the Onset of Menarche: A Test of a Sociobiological Model. Child Development, 63(1), 47-58.
Molho, A. (1988). Deception and Marriage Strategy in Renaissance Florence: The Case of Women’s Ages. Renaissance Quarterly, 41(2), 193-217.
Moor, T. & Zanden, J. (2010). Girl Power: The European Marriage Pattern and Labour Markets in the North Sea Region in the Late Medieval and Early Modern Period. The Economic History Review, 63(1), 1-33.
Morgan, V. & Macafee, W. (1984). Irish Population in the Pre-Famine Period: Evidence from the County Antrim. The Economic History Review, 37(2), 182-196.
Moring, B. (1996). Marriage and Social Change in South-Western Finland, 1700-1870. Continuity and Change, 11(1), 91-113.
Moronov, B. (2017). The Russian Revolution of 1917 Through the Prism of Demographic Modernization. Demographic Review, 4(3), 6-58.
Mowat, B. & Werstine, P., (2004). Romeo & Juliet. Folger Shakespeare Library.
Nicolson, A. & Hanley, C., (1953). Indices of Physiological Maturity: Derivation and Interrelationships. Child Development, 24: 1, 3-38.
Ori, P. (2015). Long-Term Demographic Change and local Socio-Cultural Patterns: Marriages and Household Structure in 18th-20th Century Hungary. Poland’s Demographic Past, 37(3), 7-37.
Outhwaite, R., (1973). Age at Marriage in England from the Late Seventeenth to the Nineteenth Century. Transactions of the Royal Historical Society, 23: 55-70.
Palm, L. (2001). Le Changement Cache Du Systeme Demographique Suedois A “L’Epoque De La Grandeur”: Des Mariages Adolescnets Aux Mariages Tardifs. Annales De Demographie Historique, 2001(2), 141-172.
Papadimitriou, A. (2016). The Evolution of the Age at Menarche from Prehistorical to Modern Times. Journal of Pediatric and Adolescent Gynecology, 29(6), 527-530.
Parsons, J. (1998). Mothers, Daughters, Marriage, Power: Some Plantagenet Evidence, 1150–1500, in J. Parsons (Ed.) Medieval Queenship (pp. 63-78). Palgrave Macmillan.
Podd, R., (2020). Reconsidering Maternal Mortality in Medieval England: Aristocratic Englishwomen, c. 1236-1503. Continuity and Change, 35: 115-137.
Post, J. (1971). Age at Menarche and Menopause: Some Medieval Authorities. Population Studies, 25(1), 83-87.
Razi, Z., (1980). Life, Marriage and Death in a Medieval Parish: Economy, Society and Demography in Halesowen, 1270-1400. Cambridge University Press.
Reher, D. (1991). Marriage Patterns in Spain, 1887-1930. Journal of Family History, 16(1), 7-30.
Rheubottom, D., (1988). “Sisters First”: Betrothal Order and Age at Marriage in Fifteenth-Century Ragusa. Journal of Family History, 13: 4, 359-377.
Roelants, M., Hauspie, R., & Hoppenbrouwers, R. (2009). References for growth and pubertal development from birth to 21 years in Flanders, Belgium. Annals of Human Biology, 36(6), 680-694.
Rosenberg, M., (1991). Menarcheal age for Norwegian women born 1830–1960. Annals of Human Biology, 18: 3, 207-219.
Ross, R. (1975). The ‘White’ Population of South Africa in the Eighteenth Century. Population Studies, 29(2), 217-230.
Rossiaud, J. (1988). Medieval Prostitution, Translated by Lydia G. Cochrane. Basil Blackwell.
Rotering, P. & Bras, H. (2019). The Age Difference Between Spouses and Reproduction in 19th Century Sweden. Demographic Research, 41, 1059-1090.
Scheidel, W. (2007). Roman Funerary Commemoration and the Age at First Marriage. Classical Philology, 102(4), 389-402.
Segalen, M. (1991). Mean Age at Marriage and Kinship Networks in a Town Under the Influence of the Metropolis: Nanterre, 1800-1850. Journal of Family History, 16(1), 65-78.
Seiler, S. (2018). Social Homogamy, Early Industrialization, and Marriage Restrictions in the Cantone of Lucerne, Switzerland, 1834-75. The History of the Family, 24(1), 38-66.
Stormer, C., Gellatly, C., Boele, A., & Moor, T. (2018). Long-Term Trends in Marriage Timing and the Impact of Migration, the Netherlands, 1650-1899. Historical Life Course Studies, 6(1), 40-68.
Sun, Y., Tao, F. B., Su, P. Y., Mai, J. C., Shi, H. J., Han, Y. T., Wang, H., Lou, X. M., Han, J., & Liu, J. (2012). National estimates of the pubertal milestones among urban and rural Chinese girls. The Journal of adolescent health : official publication of the Society for Adolescent Medicine, 51(3), 279–284.
Stubs, P., (1585). The Anatomie of Abuses…now newly revised recognized, and augmented the third time. Printed at London by Richard Jones.
Tenney, J. (2011). Life at the Bottom of Babylonian Society: Servile Laborers at Nippur in the 14th and 13th Centuries B.C. Brill.
Tenney, J. (2017). Babylonian Populations, Servility, and Cuneiform Records. Journal of the Economic and Social History of the Orient, 60(6), 715
Trussel, J. & Steckel, R., (1978). The Age of Slaves at Menarche and Their First Birth. The Journal of Interdisciplinary History, 8: 3, 477-505.
Tsuyda, N. & Kurosu, S. (2014). Economic and Household Factors of First Marriage in Two Northeastern Japanese Villages, in C. Lundh, S. Kurosu, et al. (Eds.) Similarity in Difference: Marriage in Europe and Asia, 1700-1900 (pp. 349-391). MIT Press.
Viazzo, P., (2003). What’s So Special About the Mediterranean? Thirty Years of Research on the Household and Family in Italy. Continuity and Change, 18: 1, 111-137.
Wrigley, E., Davies, R., oeppen, J., & Schofield, R. (1997). English Population History from Family Reconstitution, 1580-1837. Cambridge University Press.
Zanden, J., Moor, T., & Carmichael, S. (2019). Capital Women: The European Marriage Pattern, Female Empowerment, and Economic Development in Western Europe, 1300-1800. Oxford University Press.
(This note makes more sense if you first read the section on Ancient Rome.) In Hopkins’ data, about 12.6% of Roman girls married at the age of 12 or earlier (Table 1). In Bronski’s analysis of the same data, where he used a statistical tool to exclude second marriages, he got essentially the same percentage (12.5%). However, these estimates should not be accepted without reservation, as that would require that whoever wrote each individual funerary inscription to know both the year of birth and the year of marriage for those whom they commemorated. It is understood that this could not have been the case in a preindustrial society (see Clark, 2007, pp. 175-78), and, therefore, the data should probably only be used to compute the average (in which case the error, if it is random, evens out).
(Roelants et al. 2009; Sun et al., 2012; Brix et al., 2018; Golding et al., 2024; Engelhardt et al., 1995; Greil & Kahl, 2005; Dóber & Királyfalvi, 1993; Moffitt et al., 1992; Juul et al., 2006; Bruserud et al., 2020; Cameron et al., 1993; Martí-Henneberg & Vizmanos, 1997; German et al., 2015; Anderson & Must, 2005; Biro et al., 2018)
Papadimitriou reviews the literary and archeological data, and his estimate of menarche occurring at about 14 years seems to be completely based off of the literary evidence. Note that he also makes the mistake of confusing the fourteenth year for a reference to the age of 14, and not the age of 13.
Herlihy (1985) cites the 1978 original, French edition of Herlihy & Klepisch-Zuber (1985) in saying that “at Florence in 1427” the average age of a girl at marriage “was 17.6” (p. 104). I do not know French, and therefore cannot see exactly where he got this from. But, in the 1985 English version, this is given as the age for the city of Florence as calculated using proportions of women at given age groups that are not married (p. 87, table 3.10). The average age in the city of Florence is also given as 17.56 based off of cases in which the woman’s family corrected the Castasto declaration after she married (p. 210, table 7.1). It is obvious, then, that he either gets his figure from the proportion married method or from data coming from females’ families’ corrections. This should, in my opinion, be balanced with the age of 20.83, which is the corresponding average obtained from cases in which the woman’s husband’s family reported the correction.
Note that, usually this would correspond to 18.5 years on average, because the average eighteen year old would be expected to be halfway to turning 19; but, in this case, these years correspond to time passing, and not to birthdays passing. Remember that the eighteenth year of someone’s life is the one during which they are seventeen, and so someone who has lived, on average, for eighteen years, is expected to be 18.0, having just completed the year during which they were 17.
One’s age in Sui is reckoned to be one at birth, and one sui is added for each Lunar New Year which passes in one’s lifetime. Therefore, 1.5 years must be subtracted, because being one sui old at birth biases the age upward by one year, and because the average person is born six months before the next Lunar New Year, as opposed to being born one year before his next birthday, and so this biases the age by another half-year.
Note, however, that Juliet’s father remarks that two summers should pass before she is “ripe”, and ready for marriage (1.2.9-10). According to the story, she was born on “Lammas Eve” (1.3.19)—that is, the end of July—to which time there was just “[a] fortnight and odd days” (1.3.15-17), meaning that the story takes place in what would today be the second third of an English summer (though it should be noted that, during the seventeenth century, England, and the world in general, experienced a remarkably cool period, and, therefore, may have had a much shorter summer; see, e.g., Hoyt & Schatten, 1997, pp. 173-184; Figueredo et al., 2020, pp. 323-24). This leaves open the question of whether Juliet’s father included the current summer when he said that she would not be ready for marriage until she is done with two more summers. If he did, she would be two weeks shy of sixteen when she is considered marriageable; if it is not included, she will be just short of seventeen. Either way, it is remarkable that this passage, which has often been cited as evidence that it was common for girls to marry prematurely, is probably better proof that premature marriage was considered abnormal, and that it was typical to wait until the girl was at least physically mature, perhaps at 16 or 17.
See, for example, Juvenal’s Satires (Evans, ed., 1857) written about 100 A.D., which mentions, among other things, adultery, homosexuality, and sex between elite Roman women and Ethiopian slaves.
In the ancient data, 2 of 6 estimates come from declared ages; in the medieval, only 1 of 5 (Italy); in the Early Modern and Victorian periods, only a few out of 27. Furthermore, the studies of which I am aware of for the 19th and early 20th century do not show a significant trend of women understating their ages (e.g., Mason & Cope, 1987).
In the future, I will probably write a review of Joseph Bronski’s book An Empirical Introduction to Youth (2021), whose main argument is that the brain is essentially fully developed by the mid teens, for both sexes. The book is very good, especially given that Bronski wrote most of it while in high school.
I am not the first to complain about the lack of detail in his paper, despite it being one of the best studies on methodological flaws in premodern demographic data (a surprisingly competitive field). For example—Zanden et al. (2019, p. 55, fn. 144): “Molho unfortunately does not tell us how much younger the girls were reported to be in the Catasto”.
Literary records of girls getting married at 12 will be skewed toward the elite, which I already conceded to have an average age at marriage for girls of below 15. Also keep in mind that, even though menarche probably occured, on average, when the girl was 13, that would still mean that something like 15% occured when the girl was 12 if the distribution was normal and the SD was about 1. And, also, errors regarding a girl's knowledge of her own age, or the author's knowledge of her age, would be subject to error, which would probably overestimate the number of these cases.
The fact that Roman law allowed for early female marriage does not provide much evidence that marriage at the minimum age was common, since early marriage was legal in (as far as I know) every country before the twentieth century.
You should correct the statement that I said something false. I claimed they began marrying off at 12, pre-menarche. You show that menarche in ancient Rome was around 14. The Bronski citation yields a figure showing that 12-13% of Roman women were married at age 12, and 25% by age 14. Thus, my claim that they were marrying off lots of girls before puberty and starting at 12 was exactly correct, and you have proven it correct. My argument was not that all societies married people off so young: indeed my actual view, articulated elsewhere (ex. https://lymanstone.substack.com/p/the-rise-of-christians-mobs-moms ) is that ancient Rome had a very unusual family system. In fact, we have contemporary Greek writers commenting on how weird it was to them that Romans married SO early! Rome was weirdly young! Of the two societies you note as having immature marriage, one of them is indeed Roman elites! My claim was perfectly sensible!