Note: This is the revised/updated version of the original post.
It’s been five years since Nassim Nicholas Taleb had published his infamous attack on IQ, and his article has generated quite a fewresponses. For the most part, Taleb’s arguments have been thoroughly taken apart, but there always remains a few people who bring up the same talking points he did over and over again. I ended up getting roped into it around a month ago when I was at a meeting, but rather than do the responsible thing of actually paying attention at the meeting, I instead found myself in an argument about IQ and being confronted with the same arguments that were originally made by Taleb. Because of this, I figured it’d be useful to synthesize a lot of the rebuttals that were made into this single article, as well as add additional evidence supporting the validity of IQ.
Taleb starts off his attack on IQ on the grounds that it supposedly has a ‘low variance explained’ with various performances (which ones specifically he’s referring to, he doesn’t specify):
Psychometrics peddlers looking for suckers (military, large corporations) buying the “this is the best measure in psychology” argument when it is not even technically a measure — it explains at best between 2 and 13% of the performance in some tasks (those tasks that are similar to the test itself)
Taleb doesn’t provide any sources for where the 2-13% claim comes from, which is odd for someone who is so seemingly confident about his stance on IQ. Besides that, he makes a very basic mistake of misinterpreting anything that has a ‘low variance explained’ as being meaningless. The problem is that r2 is a flawed interpretation of effect size because it doesn’t tell us anything about the real world effect that one variable is expected to have on another variable. As an example, let’s assume that IQ explains ‘only’ 9% of the variance in income, so does it matter whether or not a one-point increase in IQ predicts a $10 increase in income or a $10,000 increase in income? Of course it does, and this is obvious to anyone who’s honest, but here lies the problem: r2 does not tell us how large the real-world effect is, because it expresses the effect size in a statistical sense, which is neat and all, but not in a real-world sense, so it’s not very meaningful. An r2 of 0.09 for IQ and income in the real-world means an r of 0.3, or that a 1 SD shift in IQ predicts a 0.3 SD shift in income, which is certainly not trivial. Consider the following critique of r2 from Sackett et al. (2008, p. 216):
Prototypically, admissions tests correlate about .35 with first-year grade point average (GPA), and employment tests correlate about .35 with job training performance and about .25 with performance on the job. One reaction to these findings is to square these correlations to obtain the variance accounted for by the test (.25 accounts for 6.25%; .35 accounts for 12.25%) and to question the appropriateness of giving tests substantial weight in selection or admissions decisions given these small values (e.g., Sternberg, Wagner, Williams, & Horvath, 1995; Vasquez & Jones, 2006).
One response to this reaction is to note that even if the values above were accurate (and we make the case below that they are, in fact, substantial underestimates), correlations of such magnitude are of more value than critics recognize. As long ago as 1928, Hull criticized the small percentage of variance accounted for by commonly used tests. In response, a number of scholars developed alternate metrics designed to be more readily interpretable than “percentage of variance accounted for” (Lawshe, Bolda, & Auclair, 1958; Taylor & Russell, 1939). Lawshe et al. (1958) tabled the percentage of test takers in each test score quintile (e.g., top 20%, next 20%, etc.) who met a set standard of success (e.g., being an above-average performer on the job or in school). A test correlating .30 with performance can be expected to result in 67% of those in the top test quintile being above-average performers (i.e., 2 to 1 odds of success) and 33% of those in the bottom quintile being above-average performers (i.e., 1 to 2 odds of success). Converting correlations to differences in odds of success results both in a readily interpretable metric and in a positive picture of the value of a test that “only” accounts for 9% of the variance in performance. Subsequent researchers have developed more elaborate models of test utility (e.g., Boudreau & Rynes, 1985; Brogden, 1946, 1949; Cronbach & Gleser, 1965; Murphy, 1986) that make similar points about the substantial value of tests with validities of the magnitude commonly observed. In short, there is a long history of expressing the value of a test in a metric more readily interpretable than percentage of variance accounted for.
What this means is that in the real world, using our example, IQ would be closer to explaining 30% of the variance in income, not 9%. Another problem is that since the relationship between r and r2 is nonlinear, it gives a misleading picture when comparing the predictive validity of one variable (X) versus another variable (Y) for the same outcome (Z) when using r2 (ex: If X explains 64% of the variance in Z and Y explains 16% of the variance in Z, then X is twice as predictive as Y, not four times as predictive, because the actual correlations would be 0.8 and 0.4, respectively). Taleb seems to think that saying IQ has a low variance explained with certain performances allows him to disparage its utility, reality seems to disagree. According to reality and not Taleb, a small ‘variance explained’ can have immense consequences. Here’s an example from Hunter & Schmidt (2004, p. 191):
To illustrate that r, and not r², is the appropriate index of effect size and to show that "small" rs (e.g., .20–.30) indicate substantial relationships, Rosenthal and Rubin (1979b, 1982c) presented the binomial effect size display (BESD). Although this technique requires that both variables be dichotomous (e.g., treatment vs. control or "survived" vs. "died") and requires 50% on each side of each dichotomy, it does forcefully illustrate the practical importance of "small" correlations. For example, a correlation of .32 (r² = .10) between treatment with a particular drug and patient survival corresponds to a reduction in the death rate from 66% to 34% (Rosenthal, 1984, p. 130).Thus, a relationship that accounts for only 10% of the variance means a reduction in the death rate of almost 50%. Small correlations can indicate large impacts. The BESD uses a special case — that of truly dichotomous variables — to illustrate the same principle we have presented using the more general regression analysis method.
So, in the real world, even things that only explain a small percentage of the variance can have large effects. Thus, a low variance explained is not valid grounds for dismissing the utility of IQ. But the truth is, we don’t even need to think that hard to find instances where a small variance explained has a large effect. Ryan Faulk gave more intuitive examples in one of his response videos which I will list here:
Mayonnaise only explains 5% of the variation in the tastiness of sandwiches. Therefore, hugely increasing mayonnaise levels will have no effect.
Salt explains little variation in steak tastes. Therefore, triple the salt!
In America, the proportion of people starving to death doesn’t explain much variation in health. Therefore, people don’t have to eat!
Stabbings explain little variation in physical health. Therefore, increased stabbings will be fine.
Oil production only explains around 5% of the variance in GDP per capita. Therefore, having 100 times more oil per capita won’t matter.
Ethnic diversity only explains 5% of the variance in GDP. Therefore, replacing Norwegians with Ethiopians won’t have any effect!
Sounds stupid, right? That’s because it is.
The other problem when it comes to the ‘variance explained’ argument is we need to put into context what exactly we’re comparing. On its own, IQ’s predictive validity might not seem too impressive, but what about when we compare IQ to other variables? Strenze (2007) meta-analyzed longitudinal studies with a combined sample size of over 90,000 people on the relationship between IQ and education, occupation, and income, and compared them to several other variables (father’s education, mother’s education, father’s occupation, parental income, SES index, and academic performance), and in it, we can see that IQ beats out all of them:
So, this suddenly gives a very different picture. It’s unsurprising that in the real world, there often isn’t just one variable that explains the majority of the variance in some outcome and that instead, a lot of outcomes are multifactorial, and when comparing how important different variables are, IQ is one of, if not, the most important ones. If Taleb is going to throw IQ out the window because of ‘low variance explained’, is he also willing to throw out parental income? I don’t think so.
On another note, for a guy who’s supposed to be a mathematician, Taleb doesn’t seem to understand what r2 even means, since he says this afterwards:
No measure that fails 80–95% of the time should be part of “science” (nor should psychology — owing to its sinister track record — be part of science (rather scientism), but that’s another discussion).
Taleb, an r2 of say 20% doesn’t mean the variable you’re using as a measure is failing 80% of the time (or that it is only working 20% of the time), the percentage variance explained is a measurement of the extent to which the differences in the dependent variable are accounted for by differences in the independent variable(s) in your model. You can try this yourself by randomly generating a scatterplot with any given r2 value and then calculate the percentage of the data points that fall perfectly on the trend line (spoiler alert: it won’t be the same as the r2 value). So, we’re only at the beginning of this journey and Taleb is already making an extremely basic conceptual error. A quick search on Wikipedia will tell you this:
In statistics, explained variation measures the proportion to which a mathematical model accounts for the variation (dispersion) of a given data set.
How he manages to get the interpretation of r2 wrong when Wikipedia can provide a one-sentence interpretation that is correct is beyond me.
Nonlinearity and Decoupling, a Problem That Is Not
One of the weird critiques Taleb has of IQ is that “it doesn’t satisfy the monotonicity and transitivity required to have a measure (at best it is a concave measure)”. His complaint of IQ being supposedly a concave measure is kind of amusing for a guy who was obsessing over variance explained, which isconcave, but besides that, this is just Taleb trying to use big words for absolutely no reason whatsoever. When Taleb quibbles about ‘monotonicity’, he’s really just complaining about nonlinear relationships. For instance, he presents us with this graph:
So, the relationship between SAT scores and IQ is supposedly nonlinear and the relationship gets weaker at higher ends. This result was from Frey & Detterman (2004) in which the authors conducted two studies on the relationship between IQ and SAT scores; the IQ scores were obtained from ASVAB scores using the National Longitudinal Survey of Youth 1979 in the first one and Raven’s Advanced Progressive Matrices in the second one. Taleb only decides to show the results of the first one, which just so happens to be the one that produced a nonlinear relationship. In the second study, using Raven’s Advanced Progressive Matrices, the authors obtained a correlation of .72 after correcting for range restriction, and unlike in the first study, this relationship was indeed linear. Taleb never shows this, however, although honesty doesn’t seem to be his main priority. Besides that, this graph is most likely wrong. The reason for this is because the IQ scores in the NLSY79 is capped at 130, so as a result, the people who scored the highest all got their scores squashed together. The NLSY97 extends the upper limit of IQ scores, and using it, we can see that in spite of the likeliness of range restriction being present as people with lower IQ scores or high school GPAs are much less likely to take the SAT in the first place, a linear model works just fine:
So right off the bat, Taleb is being misleading by using outdated data. He also presents the following figure:
Taleb argues that IQ is not a measure of intelligence but rather ‘unintelligence’, meaning that he believes IQ only has any predictive validity for those who are stupid. His figure shows that as more statistical noise is injected, it obfuscates the actual relationship between two variables. Because of this noise, a linear model would still pick up some correlation between the two variables even though this would be misleading. Now, it’s true that not all relationships in the real world are linear, no one has ever denied this before, but that argument goes both ways. Here’s a graph from Koenig et al. (2008) of IQ and ACT scores:
So in the case of ACT scores, it seems like an increase in IQ predicts exponentially better performance on the ACT. I find it rather strange that the SAT graph that Taleb uses sets SAT scores on the x-axis and IQ on the y-axis. Being smarter results in better scores so it’d make more sense to switch the two axes for IQ and SAT scores, and doing so produces a graph similar to the one with ACT scores, that being that IQ predicts exponentially better SAT scores. However, as is the case with Taleb’s SAT graph, this nonlinearity between IQ and ACT scores is also due to the ceiling effect of the NLSY79 capping IQ scores at 130, so in truth, the correlation between IQ and both assessment tests are probably linear. It is possible that in some cases, IQ becomes less meaningful at the extremely high ends, but it’s also possible that it becomes more meaningful. To see whether or not Taleb’s criticism of nonlinearity (and more specifically, that the relationship is concave down) holds any weight, one thing we can do is compare how well the relationship between IQ and a bunch of different life outcomes can be measured using linear versus nonlinear models. Brown et al. (2021) used data from four longitudinal cohort studies with 48,558 participants in the United Kingdom and United States from 1957 to the present for the the relationship between cognitive ability measured during youth and occupational, educational, health, and social outcomes later in life, and found that most effects followed a linear trend and that “nearly all nonlinear effects were practically insignificant in magnitude (mean incremental R2= .001) or did not replicate across cohorts or survey waves”.
There’s actually a term for this phenomenon that Taleb is attempting to describe, that being the threshold hypothesis, the idea that intelligence becomes less useful at the extremely high ends of IQ. Taleb certainly believes in it, as he says himself that:
A measure that works in the left tail not the right tail (IQ decorrelates as it goes higher) is problematic. We have gotten similar results since the famous Terman longitudinal study, even with massaged data for later studies.
I find it rather amusing that for someone who claims “we have gotten similar results”, Taleb doesn’t show any of them except for that outdated SAT graph and that table about motor vehicle fatalities which he took from Sean Last out of context.
On that table in particular, your ability to not get into a motor vehicle fatality is going to depend on abilities to which a natural limit exists for. For instance, reaction time. You cannot have a reaction time of exactly 0 seconds, you can only approach closer to 0, so as a result, the function approaches this asymptote as you go up the IQ percentile. Once you get high enough in IQ, everyone’s ability to react is so good that there is very little difference between them beyond essentially luck and hoping the other drivers around you aren’t retarded. Okay, so this is an instance of diminishing returns for increasing IQ, but it’s one that exists purely due to the natural limits of human ability. What about for everything else? Taleb’s main claim is that he thinks the threshold hypothesis exists for IQ. Is this true? It doesn’t seem to be the case for the most part. Coward & Sackett (1990) meta-analyzed 174 studies on the relationship between IQ and job performance and found nonlinearity in only 5.4-6.9% of the samples. In Arneson et al. (2011), the researchers analyzed the ability-performance relationship across four large datasets, and found not only no evidence of higher ability failing to predict better performance at the top end of the score distribution, but in fact, the relationship was often stronger at the top end. Weiss et al. (2020) critically examined the threshold hypothesis for creativity and intelligence and found no threshold for the relationship between the two using three different methods in two multivariate studies. In Gensowski et al. (2011), the authors utilized the Life-Cycle Study of Children with High Ability, or what they referred to as the “Terman data”, a 70-year long prospective cohort study of high-ability individuals, to estimate the causal effect of education on lifetime earnings, as well as the role of IQ and personality traits. The benefit of using this dataset is the fact that being one of the longest representative cohort studies in existence, the authors have the subjects’ full earning histories. The participants in this study all have a minimum IQ of 135, so it is perfect for examining whether or not extremely IQ stops being useful at high levels. So, according to this paper, the effect of IQ on lifetime earnings looks like this:
From here, we can actually see increasing returns for higher IQ on earnings, and we can speculate the reason for this, possibly due to these individuals having such an overwhelming comparative advantage, but the main point here is that even when only looking at the extremely intelligent, there is still no evidence for the threshold hypothesis. The authors also note that “even when controlling for rich background variables, IQ maintains a statistically significant effect on lifetime earnings”, suggesting that the relationship between IQ and earnings isn’t merely due to higher IQ people being more likely to come from more affluent backgrounds. In Robertson et al. (2010), we can see that using SAT scores as a proxy for intelligence, not only is there no support for the threshold hypothesis for several outcomes, quite to the contrary, the relationship became more significant at the highest quartile:
All of this seems to suggest that the threshold hypothesis isn’t really true for the most part, and therefore, IQ continues to have predictive validity even at high levels, contrary to Taleb’s claims that IQ only measures ‘unintelligence’. In fact, Taleb contradicts himself later on by talking about IQ and performance and military training:
“IQ” is most predictive of performance in military training, with correlation~.5, (which is circular since hiring isn’t random and training is another test).
This claim, aside from demonstrating that Taleb has no idea what he’s talking about, actually winds up lending more support to the validity of IQ. Why? Because as Thompson (2019) points out, firstly, a lot of tasks in military training are the same as nonmilitary tasks, such as vehicle maintenance. Secondly, the bigger problem with Taleb’s claim is that, for someone who’s supposedly a mathematician, he is literally ignoring the concept of range restriction. When the range for the two variables you’re trying to measure the relationship for is restricted, it often end up producing weaker correlations for the two variables than with the full range. Here’s a neat demonstration of this:
What relevance does range restriction have in this context? Well, the tests that the U.S. military gives screens out low ability candidates, it’s a test of ‘unintelligence’, as Taleb likes to say, meaning that this decently strong correlation of 0.5 was achieved for higher ability people, so the actual correlation without any range restriction would probably be higher. So, in an attempt to discredit IQ, Taleb’s own example ended up affirming it instead.
So, a few takeaways here. If there is nonlinearity, it’s not always problematic, and as I’ve demonstrated, it could very well be that IQ is more important at the high ends, not less. Even if we concede that in some cases, IQ’s relationship with an outcome becomes weaker at high ends, that still wouldn’t make IQ useless, because depending on how high of a score this is occurring at, it would still be extremely useful for the vast majority of people. Suppose that a given population follows the usual pattern of a normal IQ distribution with a mean of 100 and a standard deviation of 15, and let’s say that IQ stops predicting some important thing beginning at 130 and above. Okay, so that means that it is predictive for 98% of the population. Most people would consider this as highly useful, Taleb disagrees.
IQ and Job Performance
Taleb claims that IQ tests are not necessary in order to determine whether or not someone is good at a task. His argument is as follows:
If you want to detect how someone fares at a task, say loan sharking, tennis playing, or random matrix theory, make him/her do that task; we don’t need theoretical exams for a real world function by probability-challenged psychologists. Traders get it right away: hypothetical P/L from “simulated” paper strategies doesn’t count. Performance=actual. What goes in people’s head as a reaction to an image on a screen doesn’t exist (except via negativa).
On the surface, this might seem appealing, a statement that might be considered an appeal to ‘common sense’ even. However, this just doesn’t hold up when put to the test:
As you can see, IQ is actually a better predictor of job performance than work sample tests. In an update of the famous 1998 meta-analysis on the predictive validity of different selection methods for job performance, Schmidt et al. (2016) once again finds that IQ (referred to here as GMA tests) is the single best predictor of job performance when compared to 30 other variables used and significantly outperforms both work sample tests, job tryouts, and job knowledge tests:
Now, there’s been a few criticisms that has been levied before against the IQ-job performance relationship. Richardson & Nogate (2015) is one such example, arguing that most studies done on IQ and job performance are based on supervisory ratings, the reliability of which might be questionable, or that meta-analytic procedures used as flawed because they lump in studies with poor quality or overcorrect for range restriction. But, it’s been pointed out that even when objective work tests are used, the correlation still exists, and actually seems stronger if anything, and meta-analyses typically take into account study qualities. In addition, large-scale studies done in the military with objective measures still produce similar findings on the IQ-job performance relationship. On range restriction, subsequent studies since the one study primarily cited by Richardson & Nogate have shown that the correction for range restriction is not upwardly biased, but in reality, still understates the true strength of the relationship because indirect range restriction was not corrected for (Zimmer & Kirkegaard, 2023). It looks like Taleb’s little theory is lacking in support.
IQ and Income
Taleb presents us with this graph to claim that there is no relationship between IQ and income above $40,000:
He got the original graph from Zagorksy (2007) whose data came from the NLSY79. Pallesen (2019) redid this data but used the average income values for a period of ten years instead of the one year that Zagorsky looked at, since doing so creates a much more accurate picture of the long-term earnings of people. Doing so, the correlation between IQ and income above $45,000 (Taleb originally also made the cutoff $45k but decided to change it to $40k later on for some reason) is still about 0.3, just as was the case in the Zagorsky paper:
That said, the Zagorsky paper that Taleb is basing his claims on has its problems. The incomes of those with lower IQ is inflated by welfare payments, which is not shown separately. More problematic though is the fact that Zagorsky’s analysis of the relationship between IQ and income does not break down the results separately by race and sex when we have no reason to expect the relationship is exactly the same for different groups. As Lefebvre (2023) noted for race, the NLSY79 includes an oversample of blacks and Hispanics. When looking at a racially representative sample of men, the correlation was 0.4, while it was 0.35 when men and women were both included. Taleb harped earlier on about how IQ only measures unintelligence, so fortunately for us here’s the IQ-income correlation split the bottom 50% and top 50%:
So there’s hardly any difference, and remember that this is still with many of the same flaws as the Zagorsky paper. One particularly major flaw that needs to be mentioned is that Zagorsky’s analysis was only for a single year. As Dalliard (2016) notes:
There are two biasing influences that make measures of income available in many datasets highly inadequate. First, due to transitory fluctuations in income and reporting errors, an individual’s reported income may differ considerably from one year to another, which means that a single-year income may present a misleading picture of his or her income in a typical year. Secondly, there’s a lifecycle bias in income whereby income measured when an individual is too young or too old may be a poor guide to his or her long-term consumption and investment possibilities, given that income trajectories over time may differ between individuals.
Dalliard instead proposes an examination of the relationship between IQ and permanent income. He also wisely includes only earnings and wages in this analysis (no unemployment compensation and capital gains), and here’s the results both raw and log-transformed:
Something of note here is that unlike Zagorsky, Dalliard gives a non-threshold scatterplot of his results, which shows just how misleading threshold scatterplots can be. Taleb also won’t be able to pull the same tricks he did with Zagorsky’s graph with this one, too bad for him. Dalliard reports that his findings suggests that a one IQ-point increase predicts a 2.5% increase in permanent income, and a 1 SD increase in IQ predicts a ~45% increase in permanent income, stating that “For example, the expected permanent annual income for those with IQs of 85 is $22,490, while it is 45% more, or $32,730, for those with IQs of 100, and 45% more than that, $47,620, when IQ is 115, and so on”. When he separates the results for men of each race, the relationship becomes even stronger:
So, when proper methods are used, IQ does in fact correlate with income, funny how reality is just biased that way1.
Oh But the Fat Tails!
By far the single stupidest argument made by Taleb is this:
Fat Tails If IQ is Gaussian by construction (well, almost) and if real world performance were, net, fat tailed (it is), then either the covariance between IQ and performance doesn’t exist or it is uninformational. It will show a finite number in sample but doesn’t exist statistically — and the metrics will overestimare the predictability.
First off, IQ is Gaussian not ‘by construction’, IQ scores are in fact normally distributed. As Crémieux Recueil demonstrated, “Tests created in different times, by different people, from different test-making traditions, for different purposes, with different target constructs, produce a normal distribution when their items are scored right/wrong and summed. Normality isn't baked in”.
Now, if you’re dishonest, you could fudge around with the data via doing things like range restrictions until you get a really abnormal distribution with the scores, but if you have to lie about the evidence to support your claims, then that’s not a good look.
Now, Taleb loves talking about ‘fat tails’. What he’s referring to are distributions where the probability of obtaining an extreme value is higher than in normal distributions. Kurtosis is the extent to which the data falls in the tails, or in other words, a measurement of “tailedness”. Another thing that is sometimes used is the tail index, which is used to analyze the behavior of the tails of a distribution, specifically the rate at which the tails of a distribution taper off. A fat-tailed distribution can look something like this:
Or this:
Yes, we all know that not everything is nicely normally distributed in the real world, thank you captain obvious. Taleb thinks pointing out something that researchers have known about for decades is groundbreaking, but then takes it a step further by claiming that fat tails invalidates the utility of IQ. His attitude in the article makes it sound as though he’s the one dictating how statistical analyses work, but fortunately that’s not the case.
It’s true that in the real world, almost nothing is perfectly normally distributed, but that has not once ever stopped researchers from being able to find meaningful relationships and make accurate predictions. The pedantic point about non-normality can be tackled in three ways. Firstly, non-normality isn’t always large enough that it becomes a problem to model the data using a Pearson correlation. Contrary to what everyone has probably been taught during first-year statistics, your two variables don’t always have to be normally distributed because even data which is not normal can still often produce meaningful and linear relationships. Second, even if the distribution does substantially deviate from normality, there are nonparametric statistics such as the Spearman rank-order correlation or Kendall’s Tau which don’t assume normality and work on fat-tailed distributions. Third, researchers can normalize a variable which isn’t normally distributed via various different types of transformations until it achieves a sufficient level of normality, much in the same way how log transformations are used for nonlinear data, but for some reason Taleb wants us to pretend that we don’t have any methods for dealing with non-normality. For fat tails specifically, yes Taleb, you aren’t the only one to have discovered that it exists and that it can be annoying, researchers have already discovered this before you, and there have been many proposals and solutions put forth with how to handle the problem of linear regressions for this type of distribution (see, for example, Zhang & Zhou, 2018).
But, fancy statistical wizardry aside, here’s something else to consider: the distinction between fat tails in theory and in the real world. While many real-world outcomes do not follow a normal distribution and may exhibit fatter tails, those tails are ultimately constrained by the physical limits of the world. For instance, income and wealth are bound by factors such as labor, capital, productivity, and population, and at any given time, there is an upper limit they cannot exceed. Similarly, physical performance is restricted by biological constraints. Distributions with infinite variance make for interesting theoretical discussions, particularly in fields like physics and chemistry, where such distributions are more relevant and often observed in practice. However, in the context of IQ, when it comes to real-world outcomes relevant to human well-being—both individually and at the group level—these concerns are generally less pressing unless the distribution of interest is demonstrably problematic. It’s also comical that Taleb is out here making all of these bold claims and yet doesn’t really bother to back up any of what he says most of the time. Normally, the burden of proof is on the person who’s making the claim, but I guess Taleb thinks that it doesn’t apply to him. He might actually be able to make a compelling case (although even that is debatable) if he could cite some studies showing that the issue of fat tails is supposedly so large that it invalidates all the methods we currently have for statistical analyses, but for one reason or another, whether it’s because he’s too lazy to or he knows his claim is bogus, he doesn’t present any.
He also claims that “the covariance between IQ and performance doesn’t exist or it is uninformational”. Right, because he’s clearly done a great job of showing that so far, not. Maybe Taleb will still pretend that it’s “uninformational” in spite of all the evidence to the contrary I’ve presented, but that’s alright, people who are honest will be able to see the informative relationships.
Sources Taleb cites for his claims
Population Differences and Taleb’s Denial
Taleb argues that we can’t compare different populations, to which anyone who’s actually done research comparing different population knows isn’t true. What’s his justification for this? Here:
Another problem: when they say “black people are x standard deviations away”, they don’t know what they are talking about. Different populations have different variances, even different skewness and these comparisons require richer models. These are severe, severe mathematical flaws (a billion papers in psychometrics wouldn’t count if you have such a flaw).
Actually Taleb, we do know what we’re talking about when we say that “black people are x standard deviations away”, it means the difference between the average of whites and the average of blacks expressed in standard deviations of whites ((100-85)/15 = 1). Just because you don’t know what it means doesn’t mean you have to pretend that no one else does. Yes, it’s true that the distributions for different populations are not the same, again, you are just making another obvious point that we all know about it and treating it as groundbreaking. This is not anywhere near as problematic as Taleb makes it out to be. When researchers need to compare effect sizes between two different groups with two different means and standard deviations, they can just create a pooled standard deviation, that’s literally just Cohen’s d. Alternatively, they can also just, oh I don’t know, explicitly state which population’s standard deviation they’re using as the point of comparison. Here’s a graph showing the distribution of IQ scores between the races in the United States using the SAT:
A regular person can see this and have an intuitive understanding that there are meaningful differences between populations and that these differences can help researchers make useful predictions, Taleb cannot (he literally can’t, see the section “Taleb’s Standards Are No One Else’s”).
Another thing Taleb does is straight up dismiss the possibility of race differences in intelligence entirely. This is what he has to say:
The argument that “some races are better at running” hence [some inference about the brain] is stale: mental capacity is much more dimensional and not defined in the same way running 100 m dash is.
This is nothing but a straw man of the hereditarian position on race. The reason why sometimes physical differences between races are mentioned is because those are much less controversial to talk about than the brain. The point that most hereditarians are trying to get across is how ridiculous the idea that evolution stopped at the brain is, that we can accept that biological differences exist for everything else, but the brain is off-limits. It is a rejection of the claim by evolution deniers that race is ‘only skin deep’. For one, we know that there’s been more population differentiation in the brain than with skin pigmentation (Wu & Zhang, 2015):
What will convince Taleb to accept the fact that the brain isn’t immune to evolution for different populations? There are a bunch of lines of evidence like the stability of the black-white IQ gap (Chuck, 2013a; Kirkegaard et al., 2018, Figure 20), race differences in regression toward the mean (Chuck, 2013b; Hu, 2013a), race differences in brain size (Fuerst et al., 2023, Tables 2-3, 9-12; Figure 5; Lynn, 2015; Rushton, 1992; 1997; 2004) which is a variable that is causally related to intelligence (Lee et al., 2019), machine learning on MRI data that correctly guesses the black IQ when trained using a white sample (Kirkegaard & Fuerst, 2023), admixture analyses (Pesta et al., 2020, Table 7; Figure 8; Fuerst et al., 2023, Tables 4-6; Figures 2-3; Lasker et al., 2019), polygenic scores (Pesta et al., 2020, Tables 12-27; Figure 9; Fuerst et al., 2023, Figure 8; Piffer, 2019, 2023), or even just the lack of sufficient environmental differences to explain the black-white IQ gap (Last, 2020), when is it finally enough for him? A reasonable person will at some point change his or her mind when presented with overwhelming evidence, but because the real world doesn’t operate the way Taleb wants it to, he’s just going to pretend that the reality of group cognitive inequalities doesn’t exist. He continues later on by trying to make a weird and misleading appeal to history:
If you looked at Northern Europe from Ancient Babylon/Ancient Med/Egypt, you would have written the inhabitants off as losers who are devoid of potential... Then look at what happened after 1600. Be careful when you discuss populations.
Yes Taleb, we’ve all known that the first advanced civilizations were not Northern Europeans, I can assure you that our history textbooks never said otherwise. Taleb thinks that this fact is a total own of hereditarians, but that’s far from the case. The good news is that unlike Taleb, reality does not demand that one variable has to explain 100% of the variance for everything at all times. High civilization today reflects differences in intelligence between populations well, but that doesn’t mean it always had to be the case. It could just simply be that the association between civilization and genetic intelligence wasn’t as strong thousands of years ago. We know that one of the major discoveries that enabled advanced civilizations to develop was agriculture, which is much more difficult to do at high latitude regions such as Northern Europe where it was much colder. So, there was probably an optimum region for the first civilizations to form, where it wasn’t too cold, but the population was also intelligent enough to where they would be able to develop more advanced societies, and the Mediterranean certainly does seem to meet both of these conditions. As technology got better and it was possible to sustain advanced civilizations even in harsher climates, it would be then that differences in intelligence between groups will drive differences in growth and achievements. Another possibility could just be that those ancient populations were indeed relatively more intelligent than other areas at the time due to having some type of eugenic culture which served as a means of artificial positive selection. The rise and fall of civilizations could thus be due to underlying genetic changes that occur over its lifespan. Research by Piffer et al. (2023), which analyzed samples from Italy from the Neolithic Era all the way to the present, lends support to this theory, suggesting that the rise and fall of Rome was driven, at least in part, by genetic changes as evidenced by the figure below showing the polygenic scores across the samples from different time periods.
While more work needs to be done before we can get a definitive answer since the sample size here was just 127, it is a start. It would be nice if Taleb can stop pretending as if anyone anywhere at any point ever said that IQ had to consistently explain 100% of the variance in everything and throughout all points in time.
National IQ and Outcomes
Taleb dismisses the relationship that national IQs have with many important outcomes between nations because he thinks that national IQ scores are fraud. He bases this off a single figure that was derived from L&V 2006, which is a rather old national IQ dataset but it’s whatever. He says that “a few random points from the same distribution can invert the slope of the regression”, and this is what he’s referring to:
In reality though, there’s good reasons to think that the national IQs are not fraud, as Taleb claims. Firstly, there is a strong correlation between older and newer IQ datasets, suggesting that the scores are decently reliable:
The correlation is .90 for 305 Comparisons. The average of the IQ variations is only 1.07 with a standard deviation of 5.86. This means that around 75 % of the new IQ measurements do not deviate more than 5.86 points from the original measurements.
Another line of evidence comes from the fact that for some unbeknownst reason, Lynn’s results just happens to keep replicating even when it’s done by researchers who haven’t been able to earn the honor of a seething RationalWiki page written about them (Kirkegaard, 2019b, 2023). A third line of evidence is that these national IQ scores are not random across geography and correlate with winter lows, suggesting that higher intelligence is the product of intense selection pressure in cold climates. This is known as cold winters theory, and there are both molecular (see Francis. 2023) and non-molecular genetic evidence in support of it (see Kirkegaard, 2022). Another line of evidence lending support for the validity of national IQ scores is the fact that it is able to make meaningful predictions. For example, time preferences:
Or, another example would be that we can actually predict immigrant outcomes based on the IQs of their origin country (Kirkegaard, 2019d). What about national IQ and wealth? Here’s the results from Francis & Kirkegaard (2022) for GDP per capita using the old 2002 national IQ dataset:
Here’s another one, this time regressing the natural logarithm of GDP PPP per capita on national IQ and using the dataset from L&V 2012:
So no, it’s not at all evident that this pattern is just a fluke and would magically reverse with the addition of a few points like Taleb claims.2 Now, on the matter of national IQ and wealth, Taleb does bring up an interesting point:
The same people hold that IQ is heritable, that it determines success, that Asians have higher IQs than Caucasians, degrade Africans, then don’t realize that China for about a Century had one order of magnitude lower GDP than the West.
So it’s true that socialism did China dirty, I don’t think anyone (except for Marxists) has ever denied this. We also know that North Korea and South Korea exists and are quite different. Thanks for informing us that economic policies have consequences Taleb, I was completely unaware of that until now. Jokes aside, this is actually one of the less stupid points Taleb has made, and credits to him for noticing it. What Taleb is talking about is the fact that despite national IQ datasets usually showing high scores for Northeast Asians (~105), those nations for some reason lag behind Western nations. Why is that? There’s multiple competing explanations. One possible explanation comes from smart fraction theory, the idea that a country’s performance depends more on the ability of its cognitive elite rather than the average. In line with this, Kirkegaard & Carl (2022) found that while the average ability explained 57% of the variation in country performance, adding the 95th percentile score increased it to 66%. La Griffe de Lion wrote in 2004 about how the shortcomings on Verbal IQ for Northeast Asians might explain this lag, arguing that “In market economies, per capita GDP is directly proportional to the population fraction with verbal IQ at or above some determinable threshold”. We can see that doing so produces this result:
There are other literature that seeks to explain why Northeast Asians aren’t performing as well as they would predicted to be based on their IQ alone, such as Dutton (2019) which argues that Europeans sacrificed evolving extremely high levels of ethnocentrism the way Northeast Asians did in favor of a ‘genius strategy’ instead whereby a group can win and dominate by having a greater likelihood of having non-conformist members that demonstrate moderate levels of autistic traits within its population which, when combined with outlier high intelligence, creates geniuses that can come up with brilliant novel innovations. He supports this theory with evidence that Europeans are higher in personality traits that are more conducive to innovation as well as some direct genetic evidence (ch. 8). Regardless of what all these theories argue, what should be clear here is that the fact that Northeast Asia lags behind more than their IQ predicts does not mean national IQ scores are invalid, but simply that there are additional differences between populations that needs to be taken into consideration.
One criticism that Taleb levies against the validity of national IQ scores is this:
Some people use National IQ as a basis for genetic differences: it doesn’t explain the sharp changes in Ireland and Croatia upon European integration, or, in the other direction, the difference between Israeli and U.S. Ashkenazis.
Regarding Ireland, it’s false that there has been sharp rises in Ireland’s IQ. This claim is derived from the myth of supposedly low Irish IQ which has been repeated by some hereditarians. However, this is caused by poor sampling or language confounding in earlier efforts in measuring Irish IQ. Ireland’s supposedly low national IQ goes away once properly weighted, as well as any evidence of positive environmental effects raising it (Warne, 2022).
With regards to Croatia, I’m not sure specifically where Taleb got his claim from, since he barely ever cites his sources, but if I had to guess, either the gains are hollow, insignificant, or doesn’t actually exist. On the intelligence of Jews, it’s clear that Taleb doesn’t have any clue what he’s talking about, because if he did, he would realize that he was comparing apples to oranges. Jews in the United States are indeed overwhelmingly composed of Ashkenazis, but that’s not the case in Israel. The exact demographics of Israel are hard to say for certain due to misclassification being a large problem, but Recueil (2023d) does provide us with some estimates:
So what are Israel’s demographics? Drucker (2006) estimated that 61% of Israel’s Jewish population had full or partial Mizrahi ancestry. Lewin-Epstein and Cohen’s (2019) had 44.9% who were Mizrahim, 31.8% who were Ashkenazim in, 12.4% who were Soviet, 7.9% who were mixed and 3% who were Ethiopian in their sample. Lynn estimated that European Jews and non-Jewish Russians comprised 40% of Israel’s population, Oriental Jews comprised another 40%, Ethiopian Jews comprised 1.3% of the population, and Arabs comprised 20% of the population. These estimates do not completely concur and there are no official statistics. Due to ethnic mixing and personal misidentification (as when non-Ashkenazi Soviets identify as Ashkenazi, or mixed people identify as completely belonging to one category), misclassification risk in Israel-based studies is a major problem.
So, it seems that actual Ashkenazis do not even comprise half the total population in Israel. This, as Crémieux points out, is therefore perfectly consistent with Israel’s underwhelming performance on the PISA:
It’s common to hear that Israel’s PISA performance is underwhelming given the supposedly high intelligence of Ashkenazi Jews. But as I’ve noted repeatedly, Israel is not a purely or even largely Ashkenazi nation, so this is a non-sequitur. In fact, if we assign each of the relevant groups their canonical IQs, we can arrive at Israel’s PISA IQ of roughly 92.13 Using Lewin-Epstein & Cohen’s numbers: Ashkenazim are 31.8% of the Jewish part of the country with an IQ of 112; Mizrahim are 44.9% of the Jewish part of the country with an IQ of 82.5; mixed Israelis are 7.9% of the Jews with an IQ of 100; 12.4% of those who identify as Jews are Soviets with a mean of 100; Ethiopians are 3% of the Jewish population with a mean of 70; and Arabs are 20% of the total population with a mean of 82.5. This equates to an average IQ of 92.4. Israel’s comparatively low PISA is score is therefore perfectly consistent with high Ashkenazi intelligence. Moreover, this fits with two other constraints from the PISA: the 10th and 90th percentiles of Israeli scoring.
On the broader discussion on the IQ of immigrants, it’s entirely possible for immigrants to have significantly higher average IQs than their country of origin due to the selective nature of immigration, which is to say that it’s more intelligent people who tend to immigrate to the West for better prospects.3 This is a common misconception that the ‘environment’ is why immigrants tend to be better than the average of their country, when in reality, the role of ‘environment’ is completely overhyped.
The Flynn effect should warn us not just that IQ is somewhat environment dependent, but that it is at least partly circular.
At this point, the Flynn effect is a good way to gauge whether or not a person actually understands the topic of IQ, and Taleb clearly doesn’t, although props to him for saying that it shows “IQ is somewhat environment dependent” and not intelligence, regardless of whether that was intentional or not. Hereditarians never once claimed that IQ was a perfect measurement of g, and in fact, they understand very well that the occurrence of the Flynn effect is a result of the imperfect nature of IQ tests. As explained in Dutton & Woodley (2018), those IQ gains that have now been referred to as the Flynn effect are hollow on g, they’re empty gains caused by rapid improvements in narrow abilities that very weakly correlate with intelligence, and this gain is occurring so quickly over the decades that it’s been able to mask the actual decline in g that’s been occurring since the end of the Victorian Era until recently when the effect has not only disappeared but gone into reverse in several countries.4 However, since IQ is a rank-order score, it remains highly useful as a measure when comparing different individuals from the same cohort (though you can also adjust the results between cohorts for violations of measurement invariance).
IQ and Conformity
Taleb claims that IQ selects for “paper shufflers, obedient IYIs (intellectuals yet idiots), ill adapted for “real life””. He adds on to this later on by saying that “It takes a certain type of person to waste intelligent concentration on classroom/academic problems. These are lifeless bureaucrats who can muster sterile motivation”. What’s his source for all of these claims? None provided.
Fortunately, Last (2019) actually examined the relationship between intelligence and found that people who have higher IQs are actually less conformist, less risk-averse, more likely to hold minority political views, more likely to be entrepreneurs, and scored better on both formal rationality tests and situational judgement tests.
It’s not very clear what Taleb even means when he talks about how IQ apparently selects for the things he claims he does, mostly because he acts like every statement he makes is some sort of self-evident mic drop that he doesn’t need to bother defending. A massive meta-analysis by Stanek & Ones (2023) of 1,325 studies on the relationship between IQ and the big five personality traits (openness, conscientiousness, extraversion, agreeableness, and neuroticism) conveniently includes the subcomponents of each of the big five. From it, we can see that IQ has small to moderate positive correlations with self-esteem, locus of control, industriousness, achievement via independence, managerial potential, and every single subcomponent of openness (experiencing, intellect, need for cognition, ideas, curiosity, introspection, fantasy, aesthetics, being non-traditional, variety seeking, openness to emotions, tolerance, innovation, creativity, independent of conventions and others, and resourcefulness). Cautiousness and routine seeking are both ever so slightly negatively correlated with IQ (Fig. 2). Meanwhile, the relationship between IQ and risk-seeking as well as IQ and ambition are both slightly positive (Fig. 3). Although the relationship is generally weak, they are in the opposite direction of what Taleb claims, meaning that he literally just made them up from thin air, because the results of actual literature are completely at odds with him.
What’s in IQ?
So aside from Taleb constantly getting the utility of IQ wrong, it seems that he doesn’t even know what it really is:
It is a false comparison to claim that IQ “measures the hardware” rather than the software. It can measure some arbitrarily selected mental abilities (in a testing environment) believed to be useful. However, if you take a Popperian-Hayekian view on intelligence, you would realize that to measure future needs it you would need to know the mental skills needed in a future ecology, which requires predictability of said future ecology. It also requires some ergocity, the skills to make it to the future (hence the need for mental “biases” for survival).
Taleb, those mental abilities are not arbitrary, if it’s just a bunch of useless junk that psychometrics are trying to peddle, then it wouldn’t be able to consistently demonstrate valid predictive abilities with all the examples that I’ve given. IQ tests typically have verbal, mathematical, and spatial components, and most people would be able to immediately recognize that this is relevant and useful rather than be a liar like Taleb. IQ is an attempt at measuring Spearman’s g. In 1904, psychologist Charles Spearman noticed that all measures of intellectual performance tended to intercorrelate with each other, producing a positive manifold. He hypothesized that there existed a “general intelligence” which broadly underlies all of people’s ability to learn and apply information. Using factor analysis, Spearman extracted a g factor from various cognitive tests and found that this single factor explained more of the variance in the scores than all other alternative factors (Spearman, 1904). This is what people who actually know what they’re talking about (and not Taleb) mean when they say that “IQ predicts X outcome”, they mean that g predicts X outcome and IQ is a measure of g. If you were to give someone an answer key for their test and this resulted in him or her having a perfect score, you would notice that this doesn’t translate into improvements on any other measure because that score would not accurately reflect his or her intelligence.
We also have good reasons to think that IQ is measuring something real and that the scores aren’t just junk due to something known as subtest heritability, or the extent to which genetic variation explains differences in performance across various subtests of IQ tests. Nijenhuis et al. (2015) looked at the gains in IQ scores among children who were adopted into prosperous families and found that the gains were negatively correlated with subtest g-loadings. Similarly, it’s been found that IQ gains from education are not on g, but, much like with the Flynn effect, on very narrow skills (Nijenhuis et al., 2014; Ritchie et al., 2015). When it comes to race differences in IQ, the hereditarian hypothesis posits that larger differences would show up on the more g-loaded subtests, and indeed this is exactly what we see (Nijenhuis & Van den Hoek, 2016; Rushton & Jensen, 2005). A counterargument that’s sometimes used by environmentalists is that an environmental model would also predict larger differences on more cognitively complex subtests. This might be true, but it doesn’t explain why the then that even when the environment is in favor of blacks, they still score below whites. For example, blacks from very affluent backgrounds tend to score the same as whites from poor backgrounds on g-loaded tests such as the SAT:
Are we supposed to believe that blacks from families making ten times the income as their white counterparts have equally poor environments? Highly unlikely. However, even this figure is misleading because it suggests that increased family income improves test scores. This is a case of reverse causality. Using adoption studies that don’t suffer from placement bias as well as various randomized experiments, various socioeconomic factors fail to demonstrate an effect on IQ. It also doesn’t explain why interventions raised at raising IQ early on in childhood fail to produce lasting effects, as the IQ advantage held by the experimental group eventually disappears (Last, 2020). It is important when having two competing hypotheses to examine which one is able to provide a more parsimonious explanation when tested. The hereditarian hypothesis can explain all of what I just described, the environmentalist hypothesis cannot.
So no, IQ is not measuring some ‘arbitrary’ abilities, the evidence we have suggests that IQ is measuring differences in innate intelligence, and that these differences manifest as disparities in outcome, which is being captured by IQ.
Now that we have established all of this, let’s talk about some of the other things Taleb mentioned. Higher IQ is associated with being better at things like banking, using maps and transportation schedules, reading and understanding forms, and interpreting news articles (Gottfredsen, 1997). Taleb talks about ‘future ecology’ and ‘survival’ and as luck would have it, Whalley & Deary (2001) found that IQ is positively associated with, would you know it, survival, with the IQ tested at age 11 being able to predict lifespan into old age. It seems that people with higher IQs are indeed more future-oriented, so assuming that Taleb actually cares about being future-orientated, I look forward to him endorsing the use of IQ testing.
Real life never never offers crisp questions with crisp answers (most questions don’t have answers; perhaps the worst problem with IQ is that it seems to selects for people who don’t like to say “there is no answer, don’t waste time, find something else”.)
This may surprise you Taleb but not a single soul has ever claimed IQ answers every single thing in life, the whole point is that IQ adds predictive validity. Are you also against using job tryouts or a person’s experience for predicting their performance? Clearly not since you supported those things earlier, even though mental ability tests are more predictive than either of those two things (Schmidt et al., 2016). It’s only with IQ that you have this weird obsession with holding it up to this ridiculous standard that it has to perfectly predict the outcomes of something.
Taleb vs. Psychology
I have here no psychological references in this piece (except via negativa, taking their “best”), not that I didn’t read these crap papers: simply, the field is bust. So far ~ 50% of the research does not replicate, and papers that do have weaker effect.
Taleb argues that since research in psychology replicates roughly half of the time, then it shouldn’t be a part of science. Well if he wants to play that game, I’m happy to inform him that lots of fields need to be discarded aside from psychology. Ryan Faulk pointed out several studies showing low replication rates for various fields: one from Ioannidis (2005) finding a 44% replication rate for drug studies, an analysis from Baker (2012) finding an 11% replication rate for pre-clinical cancer studies, and a study by Keuken et al. (2014) (for the corrections, see Keuken et al., 2017) which looked at 17 structural brain-behavior correlation studies and found that “For all but one of the 17 findings under scrutiny, confirmatory Bayesian hypothesis tests indicated evidence in favor of the null hypothesis ranging from anecdotal (Bayes factor < 3) to strong (Bayes factor > 10)”. Taleb never mentions anywhere what he thinks the acceptable cutoff should be for a field to be a part of science when it comes to replicability. He did mention earlier that any measure that fails 85-90% of the time shouldn’t be a part of science, so let’s just say that by Taleb’s criteria, the replication rate of a fields needs to be 85% minimum for it to be considered real scienceTM. If that’s the case, lots of fields shouldn’t be a part of science. From Last (2019), we can see the replication rates of the following fields:
So, if Taleb is a diehard believer that the overall replicability is what matters most, then all of these fields should get discarded, though of course he would never agree to it. It’s not surprising that in fields of research with a lot of debate and controversies, the replication rate would not be as high, because the researchers are constantly trying to push the bounds of our knowledge. If Taleb wants a 100% replication rate, we could just ban researchers from exploring anything new and only allow them to publish findings whose results do nothing but confirm what we already know. That said, replicability isn’t as problematic as it might seem, firstly because when people talk about how psychology has a “replication crisis”, they don’t mean that every single field within psychology is total fraud. Some types of psychology research are more reliable than others. Taleb’s point would be far more valid for something like social psychology where the replication rate is anywhere from 20% to 45% (Schimmack, 2020a). Secondly, as Last points out, there are ways we can predict whether or not a study’s findings will replicate:
Consider, for instance, what happens if we use a single metric, p values, to predict whether a study will replicate. That 2015 study on replication in psychology found a replicate rate of only 18% for findings with an initial p value between .04 and .05 and 63% for findings with an initial p value of less than .001. Similarly, that 2016 study on replication in economics found a replication rate of 88% for findings with an initial p value of less than .001.
Using these and similar clues, multiple papers have found that researchers are able to correctly predict which of a set of previous findings will successfully replicate the strong majority of the time (Camerer et al., 2018; Forsell et al., 2018).
Thus, if we consumer research intelligently, we can be a lot less worried about buying into false positive results.
One of the causes of low replicability is weak statistical power. Statistical power is the probability of a hypothesis test detecting an effect if there actually exists one. While the statistical power of lots of fields isn’t ideal, intelligence research does perform much better than a lot of other fields:
On intelligence research specifically, it is one of the few fields that isn’t plagued with publication bias, as it’s estimated that less than 5% of the significant results are false positives and the expected replication rate of significant results is 70% (Schimmack, 2020b). When looking at the replicability of different psychology journals, the one with the highest replication rate is the Journal of Individual Differences, a journal which is well-known for publishing research on intelligence and personality, standing at a staggering 97% (Schimmack, 2022). Thus, even if psychology overall was indeed riddled with errors and fake research, there is no reason why intelligence research can simply be dismissed on that basis.
Taleb’s Standards Are No One Else’s
One of the many many frustrating things about Taleb is his ridiculous measurement standards that only he has, but which he acts as if is the default. There are so many instances of these scattered throughout his article, so let’s go through them.
#1. Overlapping Scores
Notice the noise: the top 25% of janitors have higher IQ than the bottom 25% of college professors, even counting the circularity. The circularity bias shows most strikingly with MDs as medical schools require a higher SAT score.
Taleb thinks that the fact that there is overlap between the scores of different occupations is ‘noise’, and that this apparently debunks IQ, even though anyone who’s honest can actually see that IQ is clearly being predictive of occupational ability. Not only that, but the figure he shows right before this one explicitly demonstrates that IQ becomes more predictive of job performance the higher in complexity the job is (r = 0.4 for low complexity jobs, r = 0.5 for medium complexity jobs, and r = 0.6 for high complexity jobs).
So, according to him, if two groups share any overlap on a thing, then that thing is useless. Let’s take a look at one of the most beloved (or dreaded) figures from Herrnstein & Murray (1994):
So, by Taleb’s logic, because the IQ distributions of blacks and whites overlap and since the top 25% of blacks are smarter than the bottom 25% of whites, this means IQ is useless garbage that there’s no real difference between the two races, or that IQ can’t tell us anything about how we can expect blacks and whites to perform, even though it very clearly does.5
It’s like the concept of averages is alien to him, possibly because he’s always up at night thinking about the ‘fat tails’, that being introduced to it is causing his brain to short circuit. It’s funny because he makes this argument in the article:
Further it is leading to racist imbeciles who think that if a country has an IQ of 82 (assuming it is true not the result of lack of such training), it means politically that all the people there have an IQ of 82, hence let’s ban them from immigrating.
Taleb, nobody is saying that a national IQ of 82 means everyone in that country has an IQ of 82, we all know what variation within groups are, but you don’t seem to understand why averages matter, because that’s what people are referring to. If you had two plane companies and company A has had a track record where 50% of their planes ended up crashing and company B has only ever had 1% of their planes crash before, does this mean that company A’s planes will always crash and company B’s planes will never crash? No, obviously not, but if I am someone who values my life and doesn’t want to die and have no way of knowing whether or not the next plane ride will crash or not, then it wouldn’t be unreasonable of me to prefer company B over company A. Until we can come up with some kind of genetic screening technique for migrants, the average is all we have to base our guesses off on.
#2. Test-Retest Reliability
Psychologists do not realize that the effect of IQ (if any, ignoring circularity) is smaller than the difference between IQ tests for the same individual (correlation is 80% between test and retest, meaning you being you explains less than 64% of your test results and, worse, you are two thirds of a standard deviation away from yourself. ).
There are so many things wrong with this. Firstly, if the correlation is 80%, then variance explained is just 64%, not less than 64%, but even then, this 64% refers to the aggregate data, not a single tester. Taleb also doesn’t tell us which IQ test he’s referring to since there’s a whole bunch of them out there with varying degrees of reliability, but he just says that the test-retest correlation is 0.8 and expects us to take it at face value. Just as an example, the third edition of the Wechsler Intelligence Scale for Children has a test-retest reliability of 0.87, 0.87, and 0.91 for Verbal IQ, Performance IQ, and Full Scale IQ, respectively (Canivez & Watkins, 1998). Taleb needs to specify where he got that 80% correlation from. Even if the correlation was actually 80%, that’s not bad at all. The way Taleb says it makes it sound like an 80% correlation is terrible even though that’s a strong relationship, again because of ‘variance explained’ which he doesn’t even seem to be able to interpret properly (see the section “Taleb Does Not Understand “Variance Explained”. Apparently, because the correlation between two things isn’t perfectly 100%, this means it’s garbage or something like that, which is a standard that only Taleb has. Well, it may shock him to discover that in the real-world, almost no relationship is ever perfect. Even if we knew of and included all the variables that had some role with an outcome in a model, it would almost never explain 100% of the variance in said outcome due to measurement error. So it’s true that IQ scores from testing and retesting don’t always match up, that’s going to be a given considering that one’s circumstances at two different points in time will never be exactly the same. Furthermore, as Hu (2013b) demonstrates from his analysis of several studies testing measurement invariance, the gains from retesting are really just gains on non-ability components, specific item content knowledge, or narrow skills, resulting in a weaker correlation between the IQ score and g.
Unlike measurements of height or wealth, which carry a tiny relative error, many people get yuugely different results for the same IQ test (I mean the same person!), up to 2 standard deviations as measured across people, higher than the sampling error in the population itself!
I have no clue where Taleb got this from because like usual he doesn’t bother to cite his sources. He’s also clearly exaggerating here with the 2 standard deviations claim, assuming that the test is highly g-loaded, someone who scores 100 is almost certainly not going to score a 70 or a 130 the next time, that’s just bullshit he made up.
#3. “IQ Doesn’t Satisfy the Transitivity Required”
Regarding transitivity, that is only a strict requirement in Taleb’s head, that IQ needs to satisfy this transitivity requirement is something he just made up. This is also just a speculative claim on Taleb’s part, because he has no way of proving whether or not IQ satisfies a certain level of transitivity. He needs to cut the crap with these absurd requirements that he reserves exclusively for IQ, saying that IQ isn’t perfectly transitive is about as helpful as saying that the correlation between IQ and something isn’t perfectly 100%, like okay so what? We all knew that, and the point never was that IQ can perfectly explain everything, it’s always been about the fact that IQ adds enough predictive validity for it to be worth using, and Taleb has not been able to prove otherwise.
#4. IQ and Detecting Convexity
IQ doesn’t detect convexity (by an argument similar to bias-variance you need to make a lot of small inconsequential mistakes in order to avoid a large consequential one. See Antifragile and how any measure of “intelligence” w/o convexity is sterile edge.org/conversation/n…).
Now he’s really grasping at straws to find anything to invalidate IQ that he can come up with (it’s rather telling when you need to try this hard to invalidate something which is supposedly ‘pseudoscientific swindle’). When Taleb talks about ‘convexity’, he’s means this (since his explanation is in another article):
The beneficial properties have to reside in the type of exposure, that is, the payoff function and not in the "luck" part: there needs to be a significant asymmetry between the gains (as they need to be large) and the errors (small or harmless), and it is from such asymmetry that luck and trial and error can produce results. The general mathematical property of this asymmetry is convexity (which is explained in Figure 1); functions with larger gains than losses are nonlinear-convex and resemble financial options. Critically, convex payoffs benefit from uncertainty and disorder. The nonlinear properties of the payoff function, that is, convexity, allow us to formulate rational and rigorous research policies, and ones that allow the harvesting of randomness.
Figure 1- More Gain than Pain from a Random Event. The performance curves outward, hence looks "convex". Anywhere where such asymmetry prevails, we can call it convex, otherwise we are in a concave position. The implication is that you are harmed much less by an error (or a variation) than you can benefit from it, you would welcome uncertainty in the long run.
Okay, so IQ might not detect convexity, fine, I don’t know whether or not that’s really the case, Taleb also doesn’t give any sources for his claim as usual, so I’m willing to agree that his little theory should be tested (if it can be, that is), but the more important question is why exactly this somehow makes any measure of intelligence “sterile”, because it doesn’t, that’s once again just Taleb’s personal standards. One way we could test this is by looking at the relationship between IQ and trading and making financial investments. Grinblatt et al. (2011) analyzed whether or not IQ influences trading behavior, performance, and transaction costs using data from two decades of IQ scores of nearly every Finnish male of draft age. The authors of this study found that “Controlling for a variety of factors, we find that high-IQ investors are less subject to the disposition effect, more aggressive about tax-loss trading, and more likely to supply liquidity when stocks experience a one-month high. High-IQ investors also exhibit superior market timing, stock-picking skill, and trade execution”. The results showed that those with high IQ did around 4.9% better per year than those with low IQ due to making better stock selections and achieving lower transaction costs. Over a lifetime, this cumulative advantage will almost certainly result in massive differences accumulating, with higher IQ people being able to have far higher net worth.
#5. Small Correlations
Like with “variance explained”, Taleb also seems to think that a small but real correlation doesn’t exist. Here’s his reasoning:
Again Taleb, your standards are not the standards of everyone in statistics. Is it true that noisy data is suboptimal? Yes. Is it also true that noise can obfuscate what’s actually going on between two variables? Sure, but there’s a huge leap between that and basically treating any weak correlation as completely meaningless. It’s not as though it’s absolutely impossible to discern an actual relationship from complete random noise, things like the density of the data, how large the sample is, trying to run the model with multiple different regressions and comparing them, or how significant the results are (if hypothetically let’s say p < 0.001 then I’d be inclined to think the relationship is real), etc. are just a few ways we can attempt to gauge whether or not a real relationship exists. For Taleb to dismiss small correlations entirely is just insane, especially since he almost certainly wouldn’t do the same for variables aside from IQ even though they often have weaker correlations. It’s also misleading because small correlations can have large consequences. Here’s a hypothetical visualization:
As you can see, changing the correlation between hours spent on social media and well-being from 0 to -0.16 caused the depression rate to increase from 0.13 to 0.2, an increase of over 50%. Another demonstration of the effect that small correlations can have is with regards to selecting candidates. Let’s say that in a pool of candidates, half of them have satisfactory characteristics, and let’s say that as an employer, I want to select for the best candidates, and so I am extremely stringent about the selection process. If I set my selection ratio to only 0.05, or 5%, and use test scores as my method of selection, what is the probability that the candidates I selected are satisfactory depending on what the correlation between test scores and satisfactory characteristics is? Fortunately, we don’t have to speculate what the answer would be, here they are from Taylor & Russell (1939, p. 575):
As you can see, even when the correlation is small, it can result in large increases in the odds of selecting a satisfactory candidate. A correlation of just 0.2 results in over two-thirds of the selected candidates being satisfactory, and when the correlation is 0.3, it’s almost three-quarters. As is the case with ‘variance explained’, it can be misleading to only look at the values and not the real-world effect.
Speaking of the real world, another problem with Taleb’s argument is that effect sizes tend to not be very large in reality. Yes, everyone wants to be able to find correlations of >0.5 (although in Taleb’s case since anything that explains less than 50% of the variance is apparently useless garbage, it’s more like >0.7 for him). However, that just doesn’t happen very often. In fact, it usually doesn’t happen.
As can be seen here, you’d be considered fairly lucky to get correlations larger than 0.3. So, if we had to apply Taleb’s standards to the real world, almost everything would be invalid. Again, his standards are no one else’s.
Final Thoughts
Overall, Taleb’s article was bad, really bad. For a guy who is so confident about his stance on IQ, it’s truly incredible that he made all the mistakes that he did. Taleb seems completely ideologically driven when it comes to the topic of IQ and is completely unwilling to even acknowledge all the compelling evidence in its favor. One of the things Taleb does is constantly insult advocates of IQ or call them names, quite childish for a man who’s supposed to be regarded highly and also quite telling of his attitude towards people who disagree with him. When all is said and done, it’s pretty clear that Taleb’s personal biases against IQ prevents him from seeing the overwhelming evidence that IQ is valid and useful. He thinks that the people who promote IQ are either racists/eugenicists or psychometric peddlers looking to get rich, it never even crosses his mind once that maybe the reason why people promote it is because it’s a good tool for making sense of the world around us. The words ‘racist’ and ‘eugenicist’ are nothing more than empty moral pejoratives used to instill fear against those who are able to think independently enough to not blindly obey our current institutional authorities or our modern sensibilities. Lots of things are eugenic Taleb, and if you’re so committed to fighting it, then the only thing that awaits Western civilization is ruin. It’s time to put this delusion to rest and acknowledge reality for what it is. A challenge for Taleb would be to have him come up with something, anything, that’s better to use than IQ for predicting all of the things I’ve went through in this article, and for that thing to satisfy all the absurd requirements that he demands of IQ. Maybe it’s unpleasant to think about just how much of our life has already been mapped out for us when we were born, but ignoring it isn’t going to do anyone any good. Individuals are born extremely unequal, group differences are significant and likely genetic in origin, and IQ captures both of these inequalities very well, and that’s the truth, and it’s an uncomfortable one, but it’s time that we faced it instead of continuing to run away from it.
Heretical Insights is a reader-supported publication. To receive new posts and support our work, consider becoming a free or paid subscriber.
It’s important to note that Dalliard’s analysis shows that the strength of the IQ-permanent income correlation differs by race and sex. The relationship is far stronger for men (r2 = 0.226) than for women (r2 = 0.087). Dalliard theorizes that the lower variance explained for women is due to many women not being primary breadwinners in their families and so are less likely to realize their full income potential.
Aside from how this claim fails all these sniff tests, Werkat (2024) has also demonstrated that such a claim can be tested via bootstrapping. As it turns out, Taleb is just flat out wrong on the notion that a few points can magically invert the slope.
The selectivity of immigration depends on the country of origin, but nonetheless it’s generally supported by existing academic literature that immigrants are self-selected to an extent. For additional readings, see Lazear (2021) and Vandor (2021).
In response to Dutton and Woodley’s claims of intelligence decline in the West being a result of dysgenic fertility, Bratsberg & Rogeberg (2018) disputed this by arguing that the reversal of the Flynn Effect can be explained by environmental factors. Their evidence for this is from analyzing three decades of Norwegian male birth cohorts and finding that the decline is happening within families. The authors use this finding to claim that since the decline in IQ is occurring within the same families, it cannot be explained by dysgenic fertility. However, deriving such a conclusion based on those observations is faulty. Due to the imperfect nature of assortative mating, it is more than possible that even within families, dysgenic fertility can occur after a few generations if people are forced to pair off with those of worse genetic quality. As pointed out in Frost (2022), Bratsberg & Rogeberg’s analysis fails to take into account that an increasing number of siblings in Norway are actually half-siblings, and women who have more children are more likely to have them with more than one man. Moreover, children are increasingly born to divorced women who have entered into relationships with men with the lowest educational levels, implying women are forcing themselves to ‘date down’, and this would therefore be perfectly compatible with the findings of IQ decline within families across generations. So, while Bratsberg and Rogeberg’s findings might be accurate, their conclusion that the reversal of the Flynn Effect is a byproduct of environment is a huge leap and unsupported. In reality, the results of their study are completely compatible with that of Dutton and Woodley’s dysgenic fertility model.
This is a good rebuttal. I'm not sure if Taleb is aware of something called the Streisand effect. But the more he writes to debunk IQ, the more attention he draws to the subject. And more people will become more aware of it.
Something that you didn't mention but I try to bring up on topics like IQ. MRI machines get better and cheaper over time. I firmly believe that in the next 30 years, we will have a MRI machine capable of scanning and counting neurons and their connections very accurately in the brain. When that happens, we will have a physical quantity to IQ.
Imagine scanning the brains of different population groups and finding out that yes, different groups do have different number of neurons. MRI machines can measure cranial volume accurately and that correlates with IQ. But most people dismiss this as phrenology. (And whale brains are huge compared to humans). But when we have machines that can count neurons accurately? That will be a game changer.
Decided to spend an evening on this and I shit you not the first bullet point from his original article already told me everything I would need to know:
"Racists/eugenists, people bent on showing that some populations have inferior mental abilities based on IQ test=intelligence; those have been upset with me for suddenly robbing them of a “scientific” tool, as evidenced by the bitter reactions to the initial post on twitter/smear campaigns by such mountebanks as Charles Murray. (Something observed by the great Karl Popper, psychologists have a tendency to pathologize people who bust them by tagging them with some type of disorder, or personality flaw such as “childish” , “narcissist”, “egomaniac”, or something similar). Note the online magazine Quillette seems to be a cover for a sinister eugenics program (with tendencies I’ve called “neo-Nazi” under the cover of “free thought”.) Note I am finding statistical flaws in Richard Plomin’s work — the pope of twin studies (see intransitivity of correlation in my technical addendum; he doesn’t get it)."
Why I engaged more is beyond me when he already made it clear he was going to call all honest genuine detractors Neo-Nazis regardless.
I'm so annoyed that they do this. They call everyone else Neo-Nazis and they get to act as if it's even remotely sensible or professional. Why should I not just call them pedophiles, psychopaths, or some other unrelated slur which they have not yet proven themselves to be, and be done with the discussion?
I promise Allah right here right now the next person who just calls me a racist, or a Fascist for questioning Jan 6th narrative (for example) I'll just call them a pedophile and be done with it. I have no patience in politics anymore and I blame Democracy and intellectual degenerates such as Taleb.
Overall, a very good article you present your arguments efficiently, yet very thoroughly.
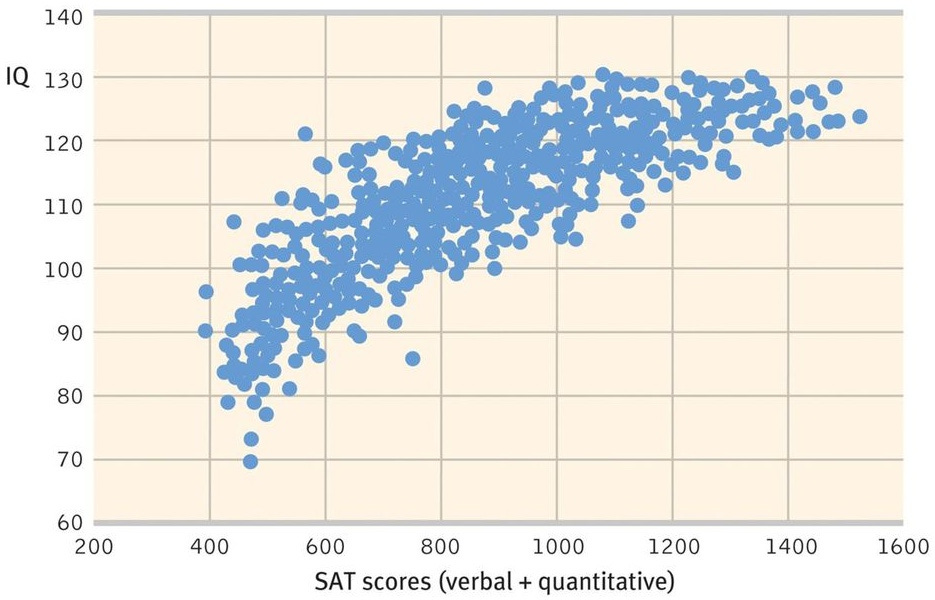
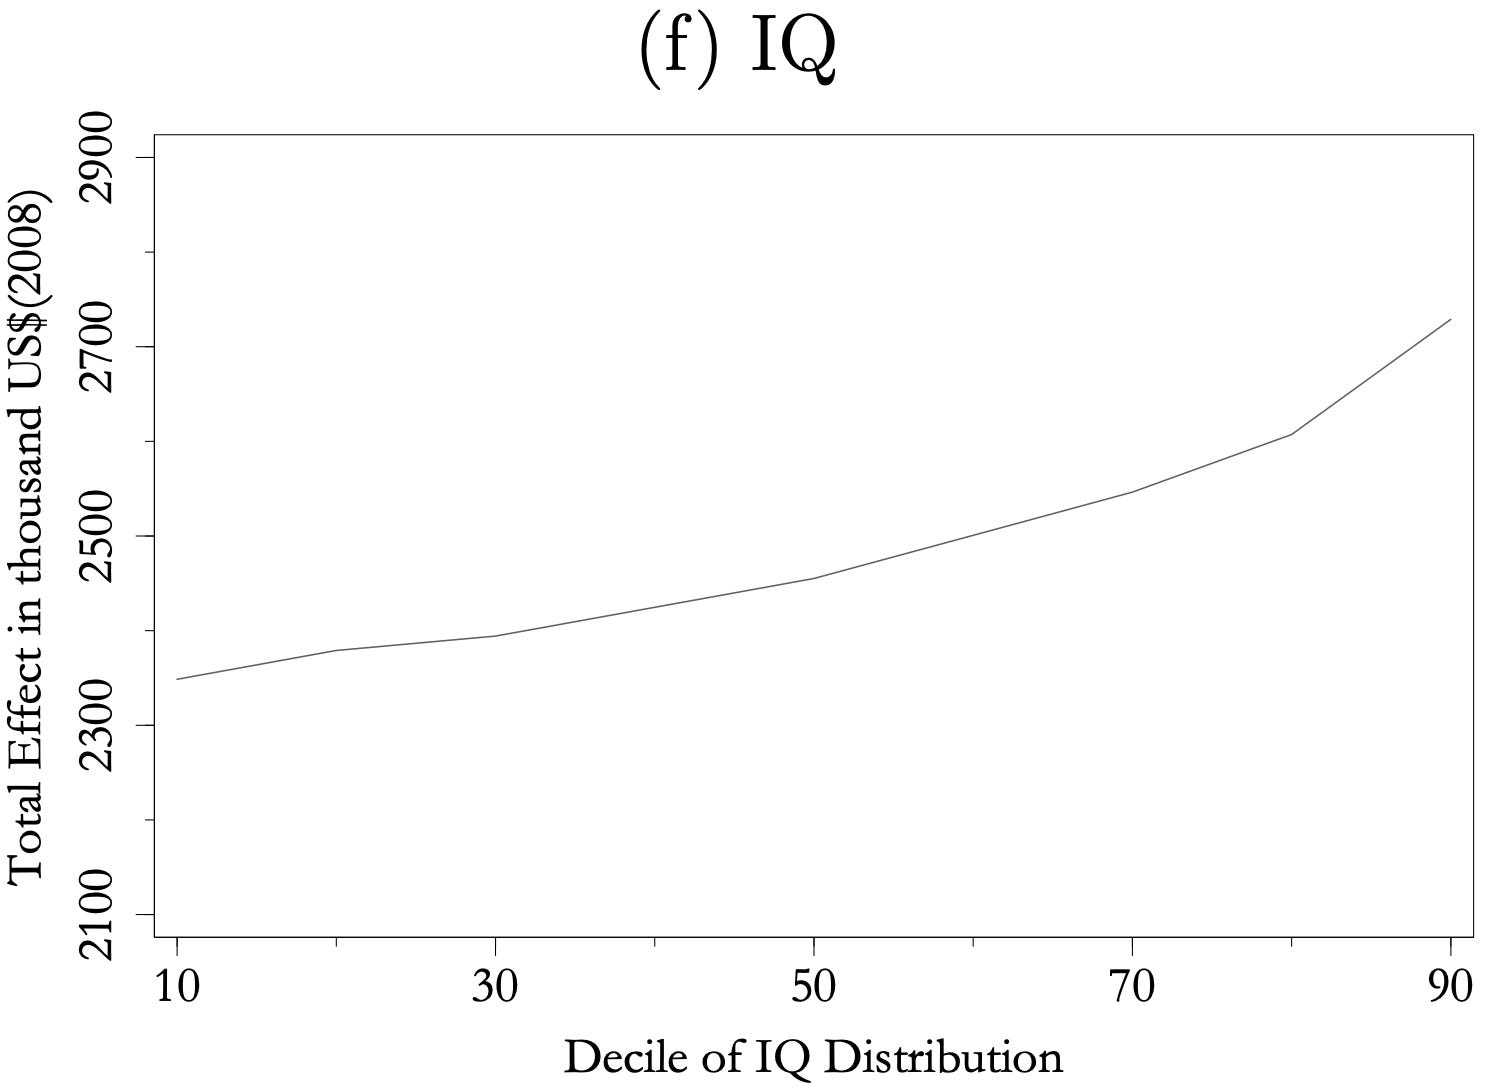
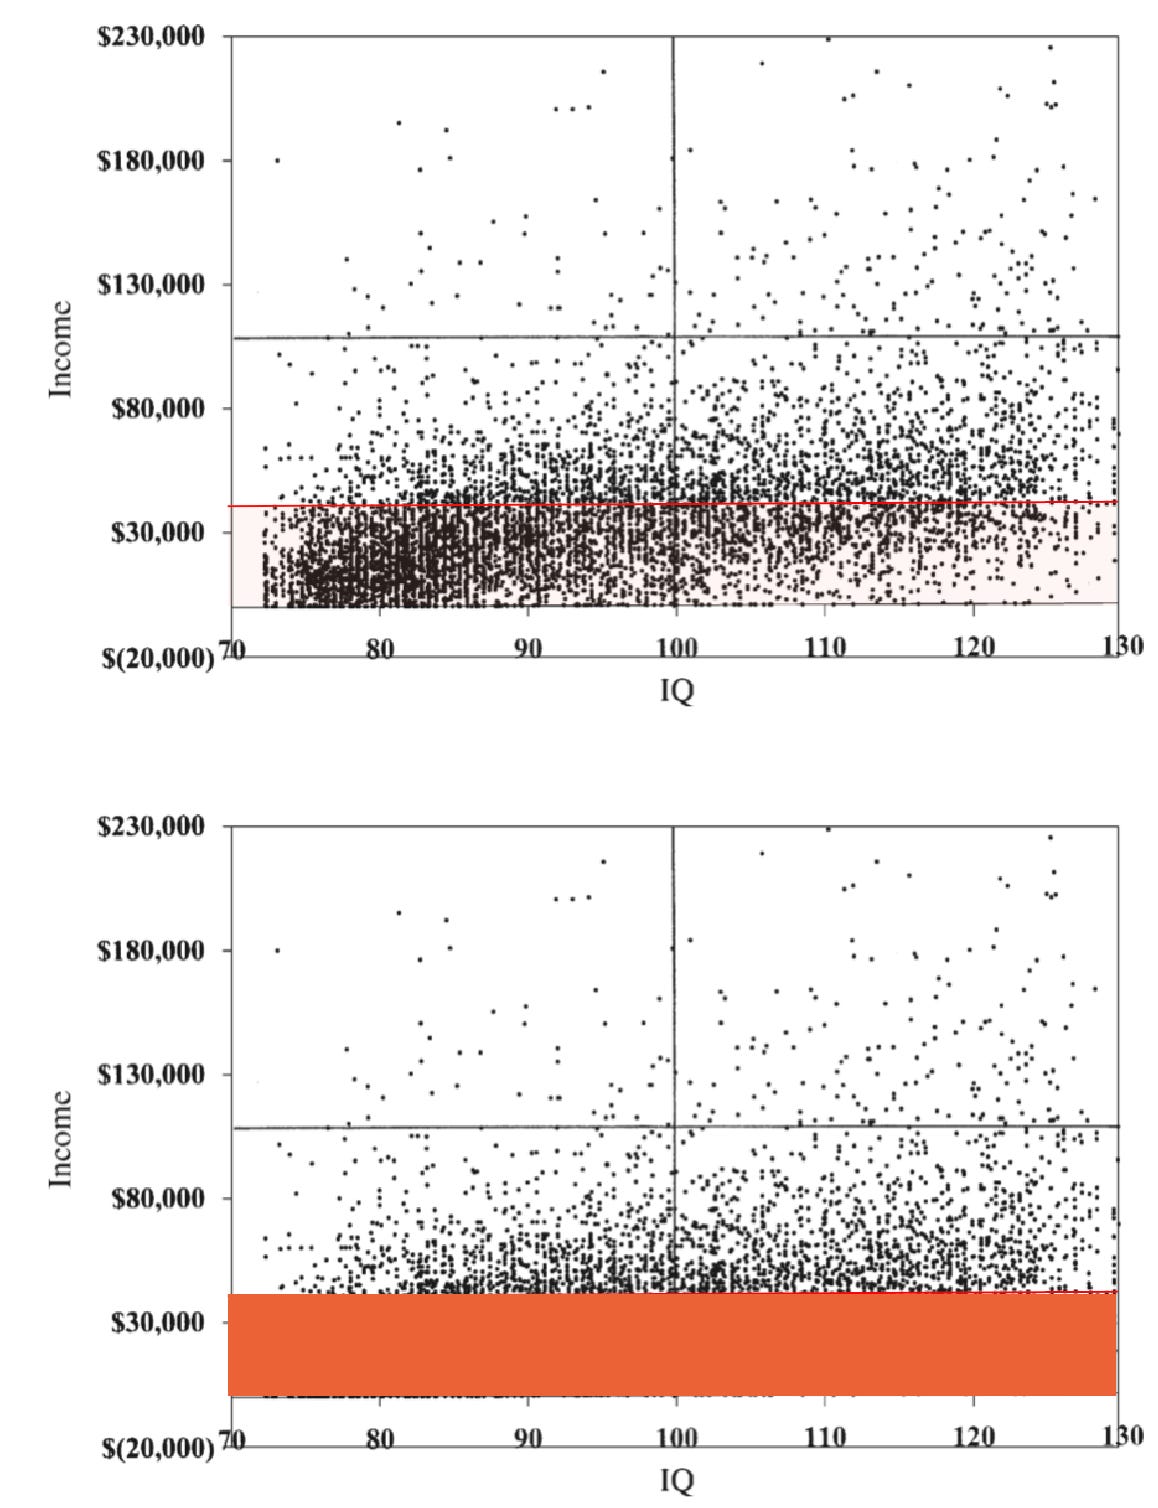
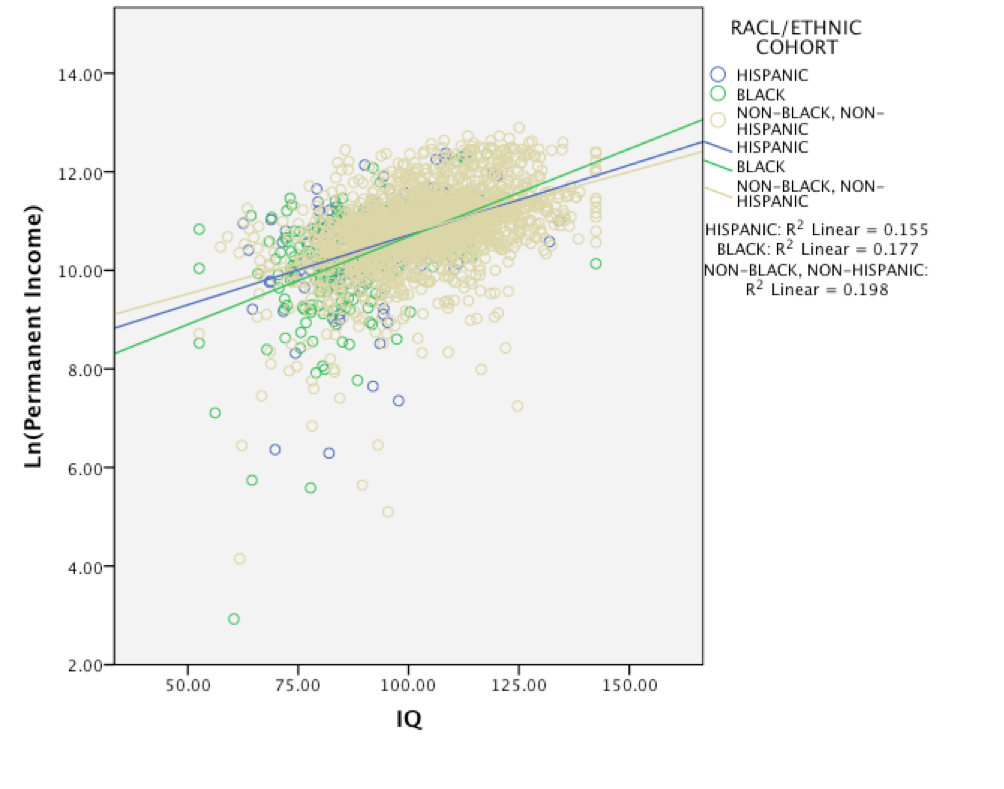
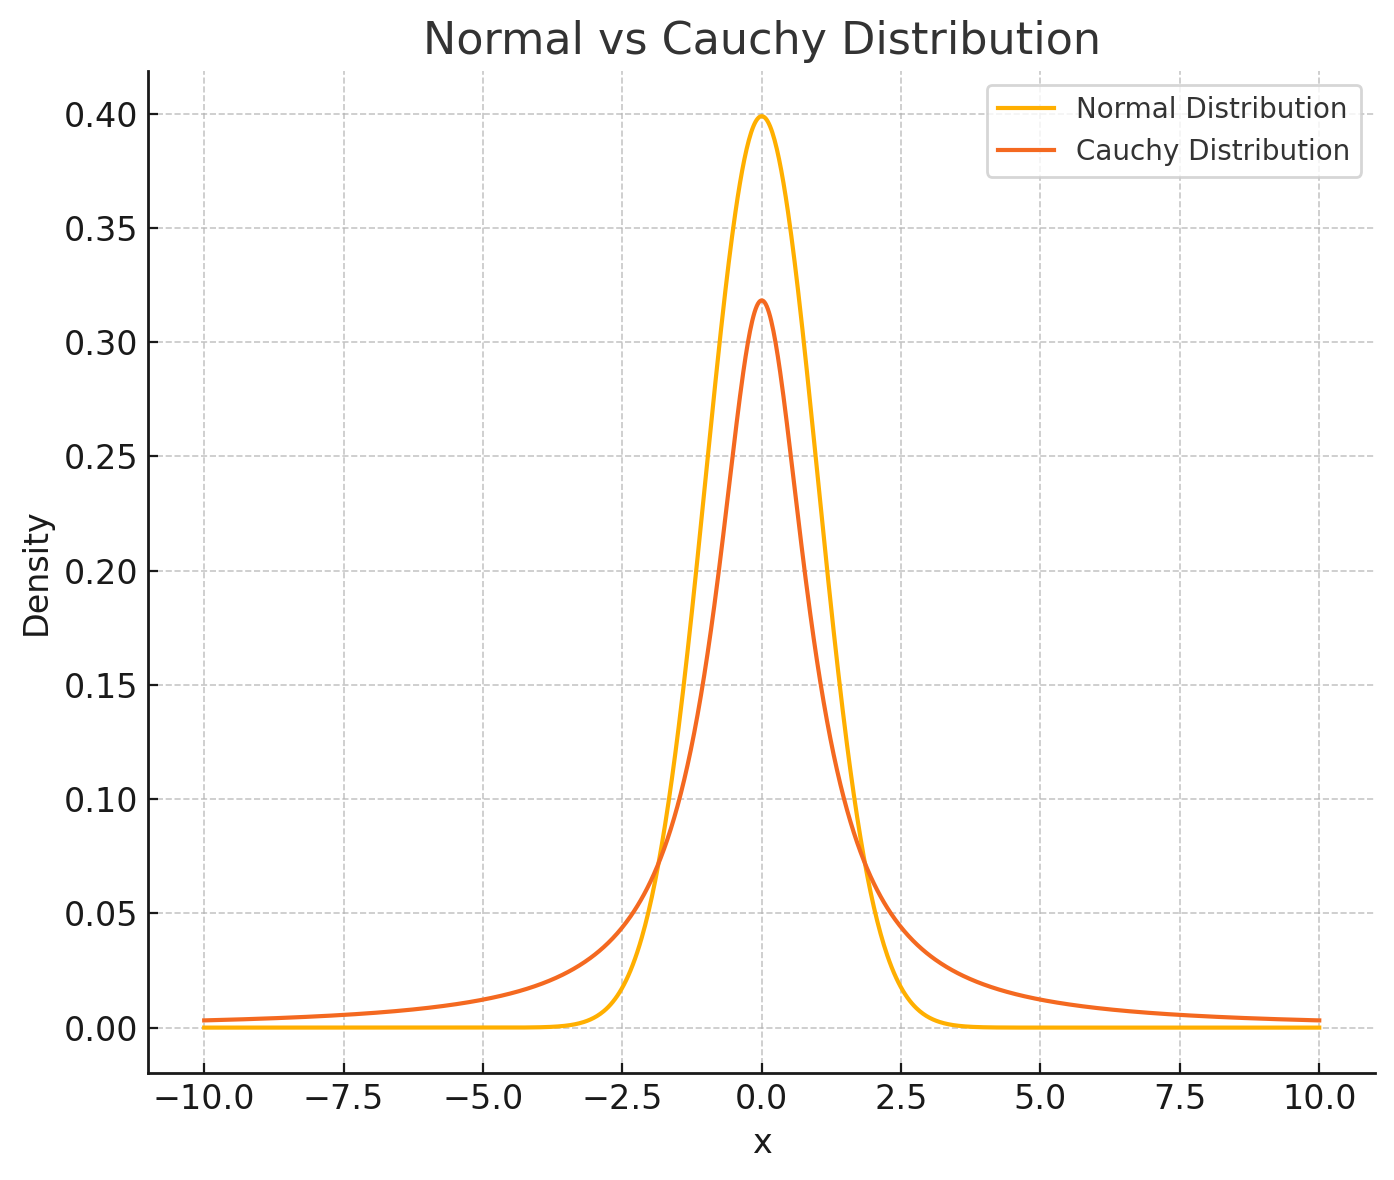
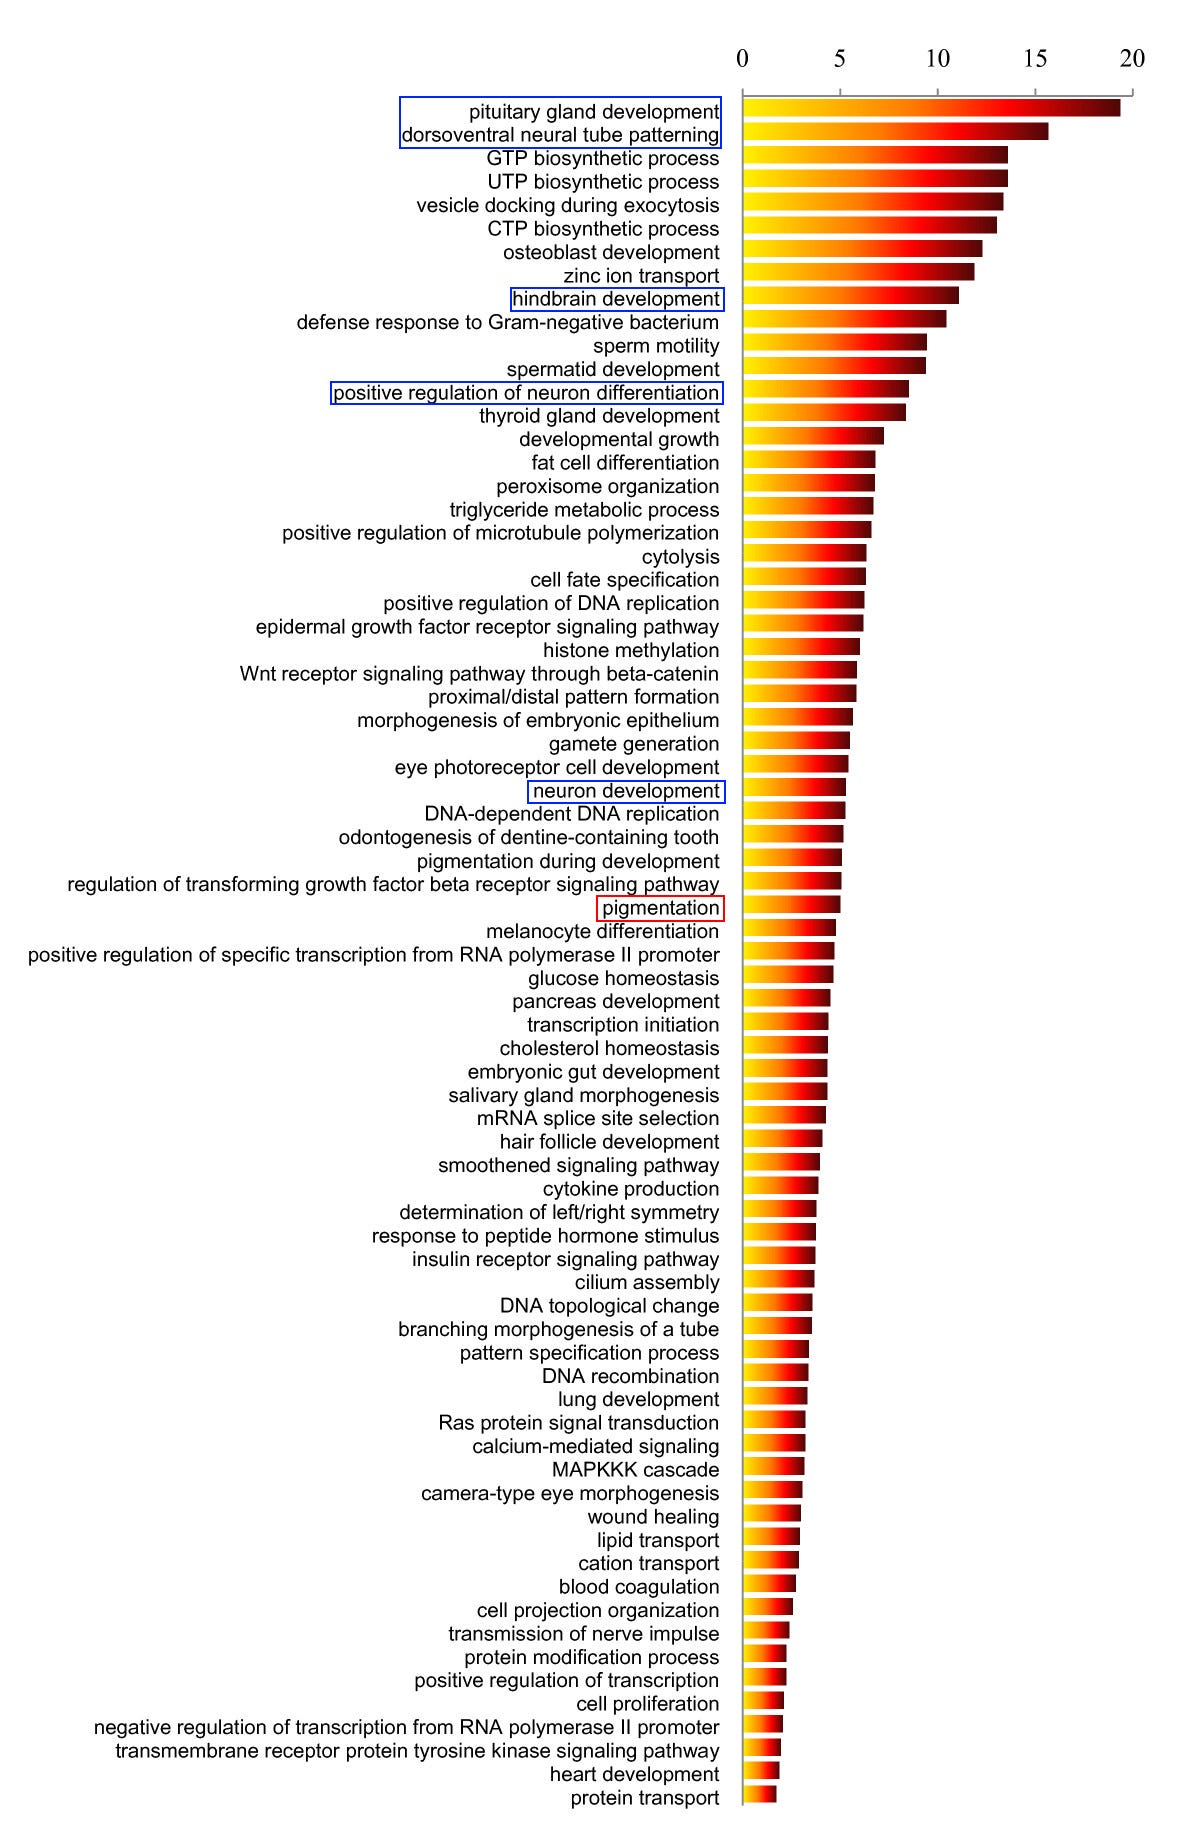
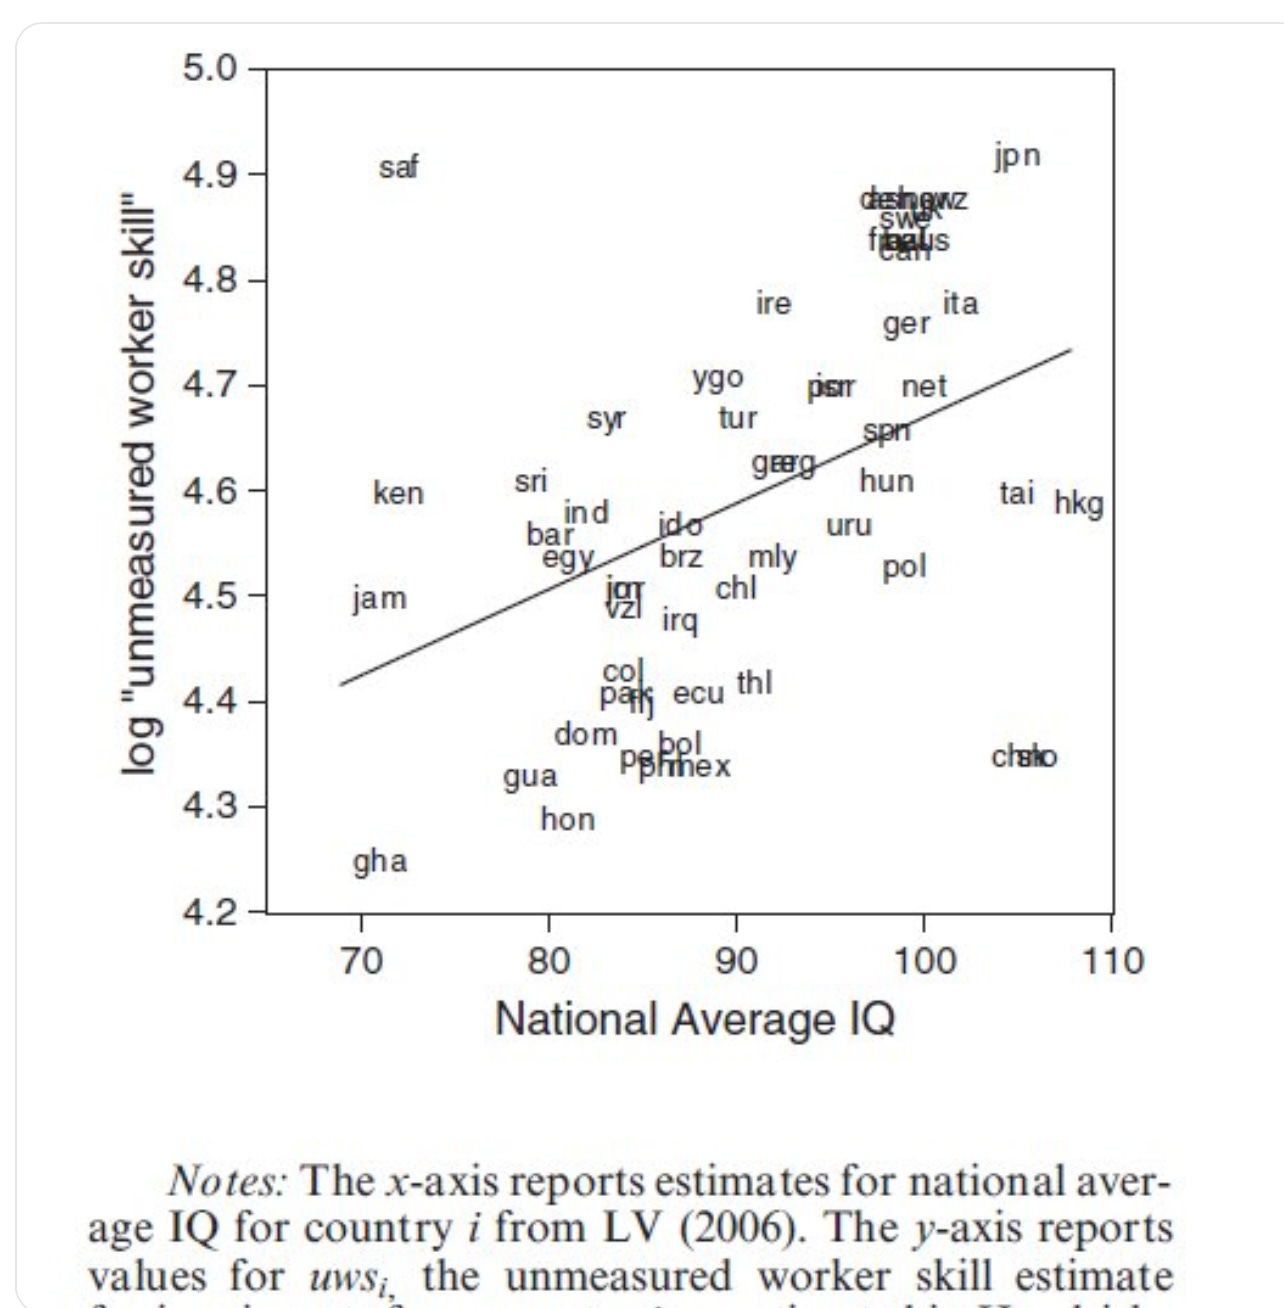
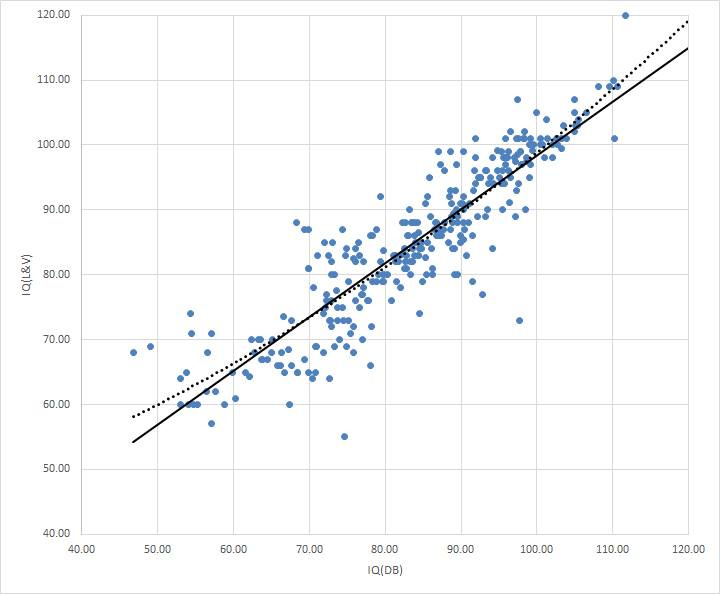
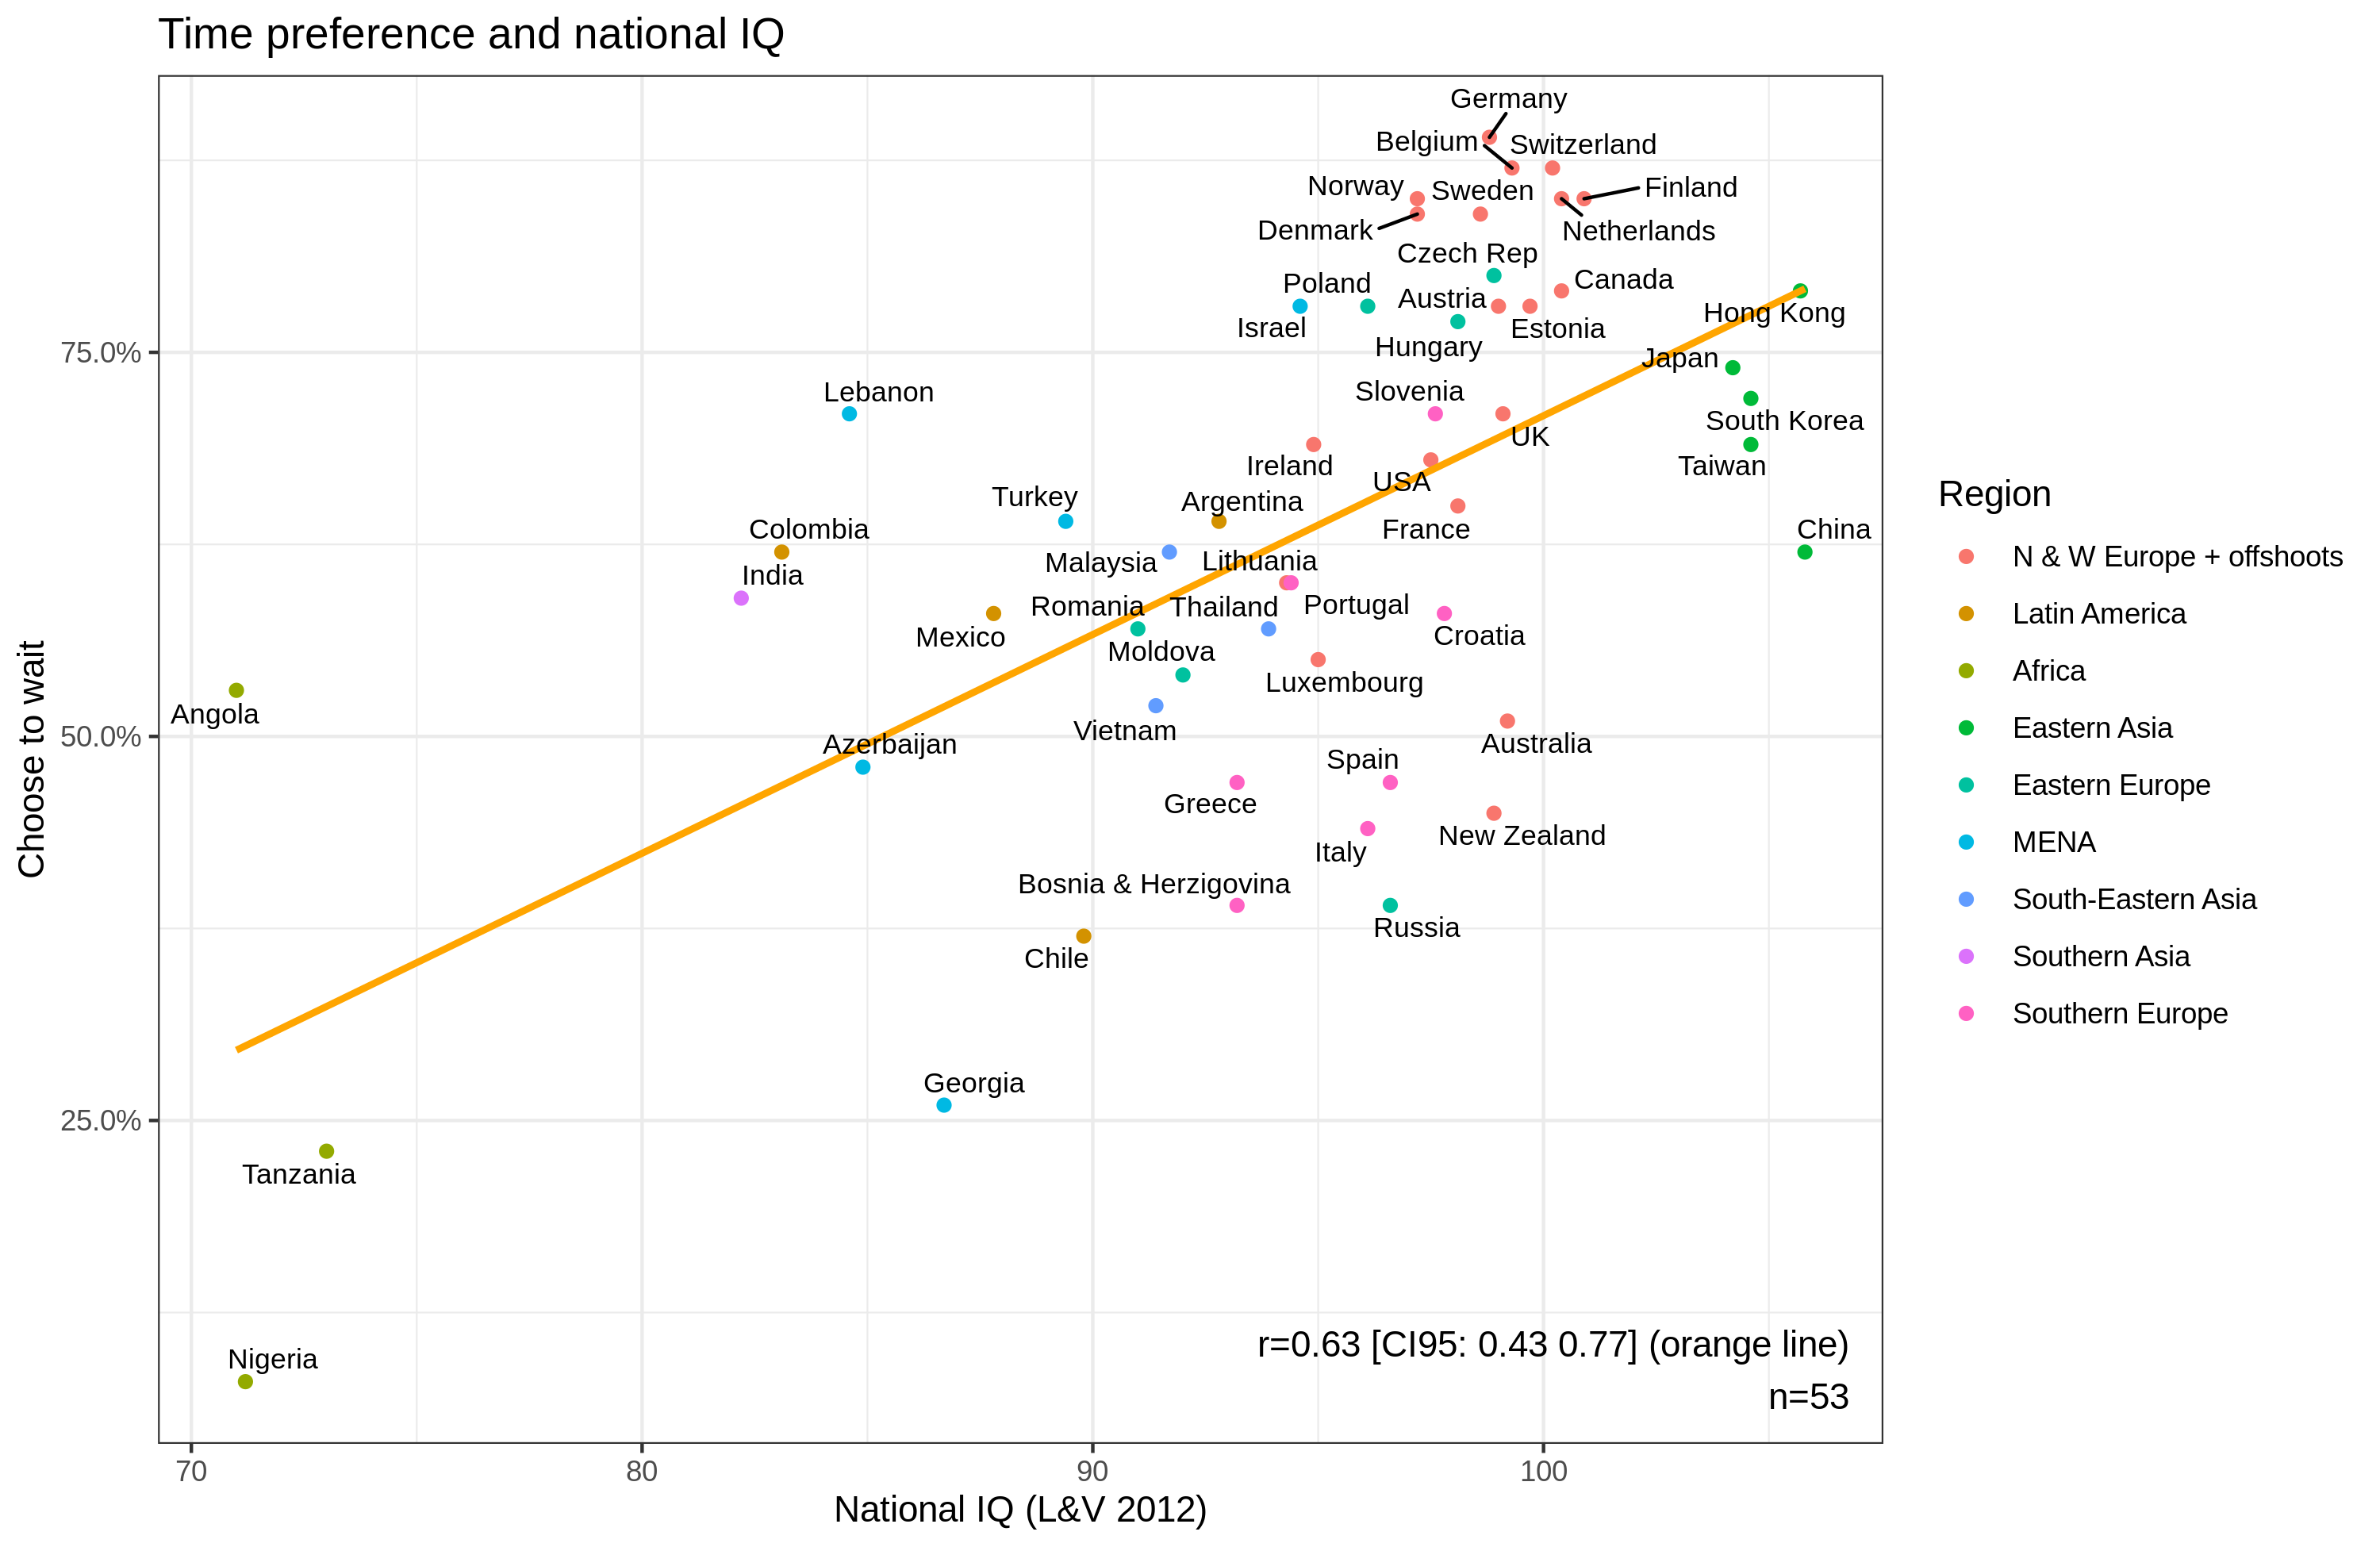
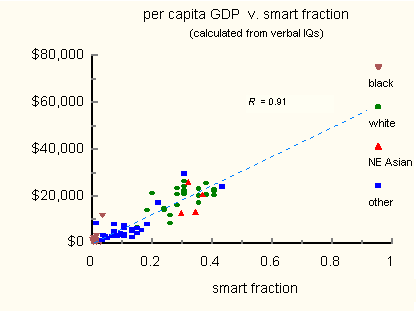
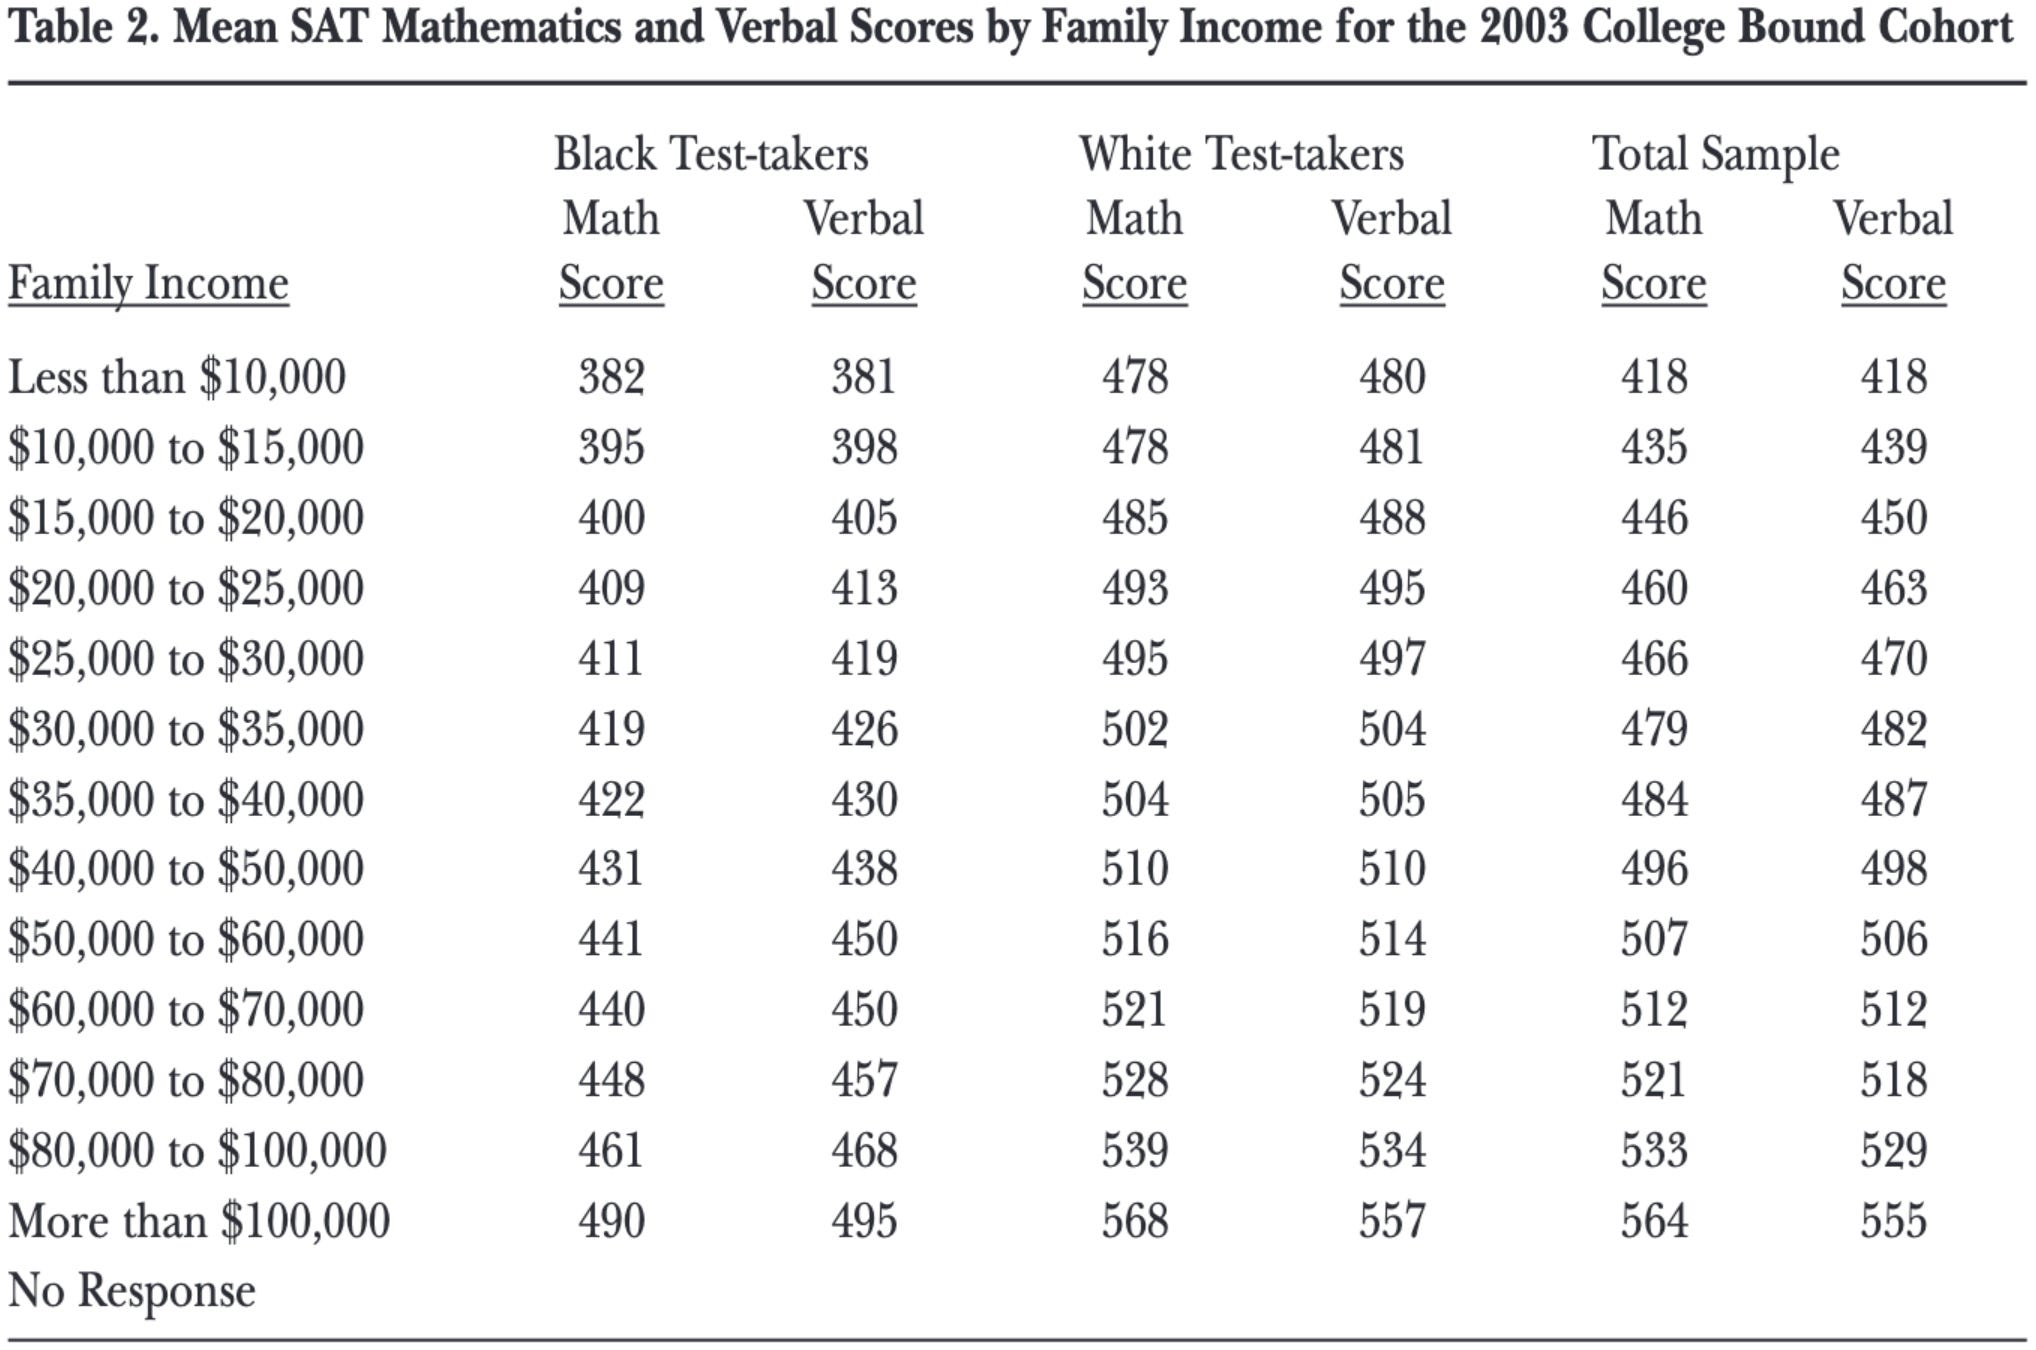
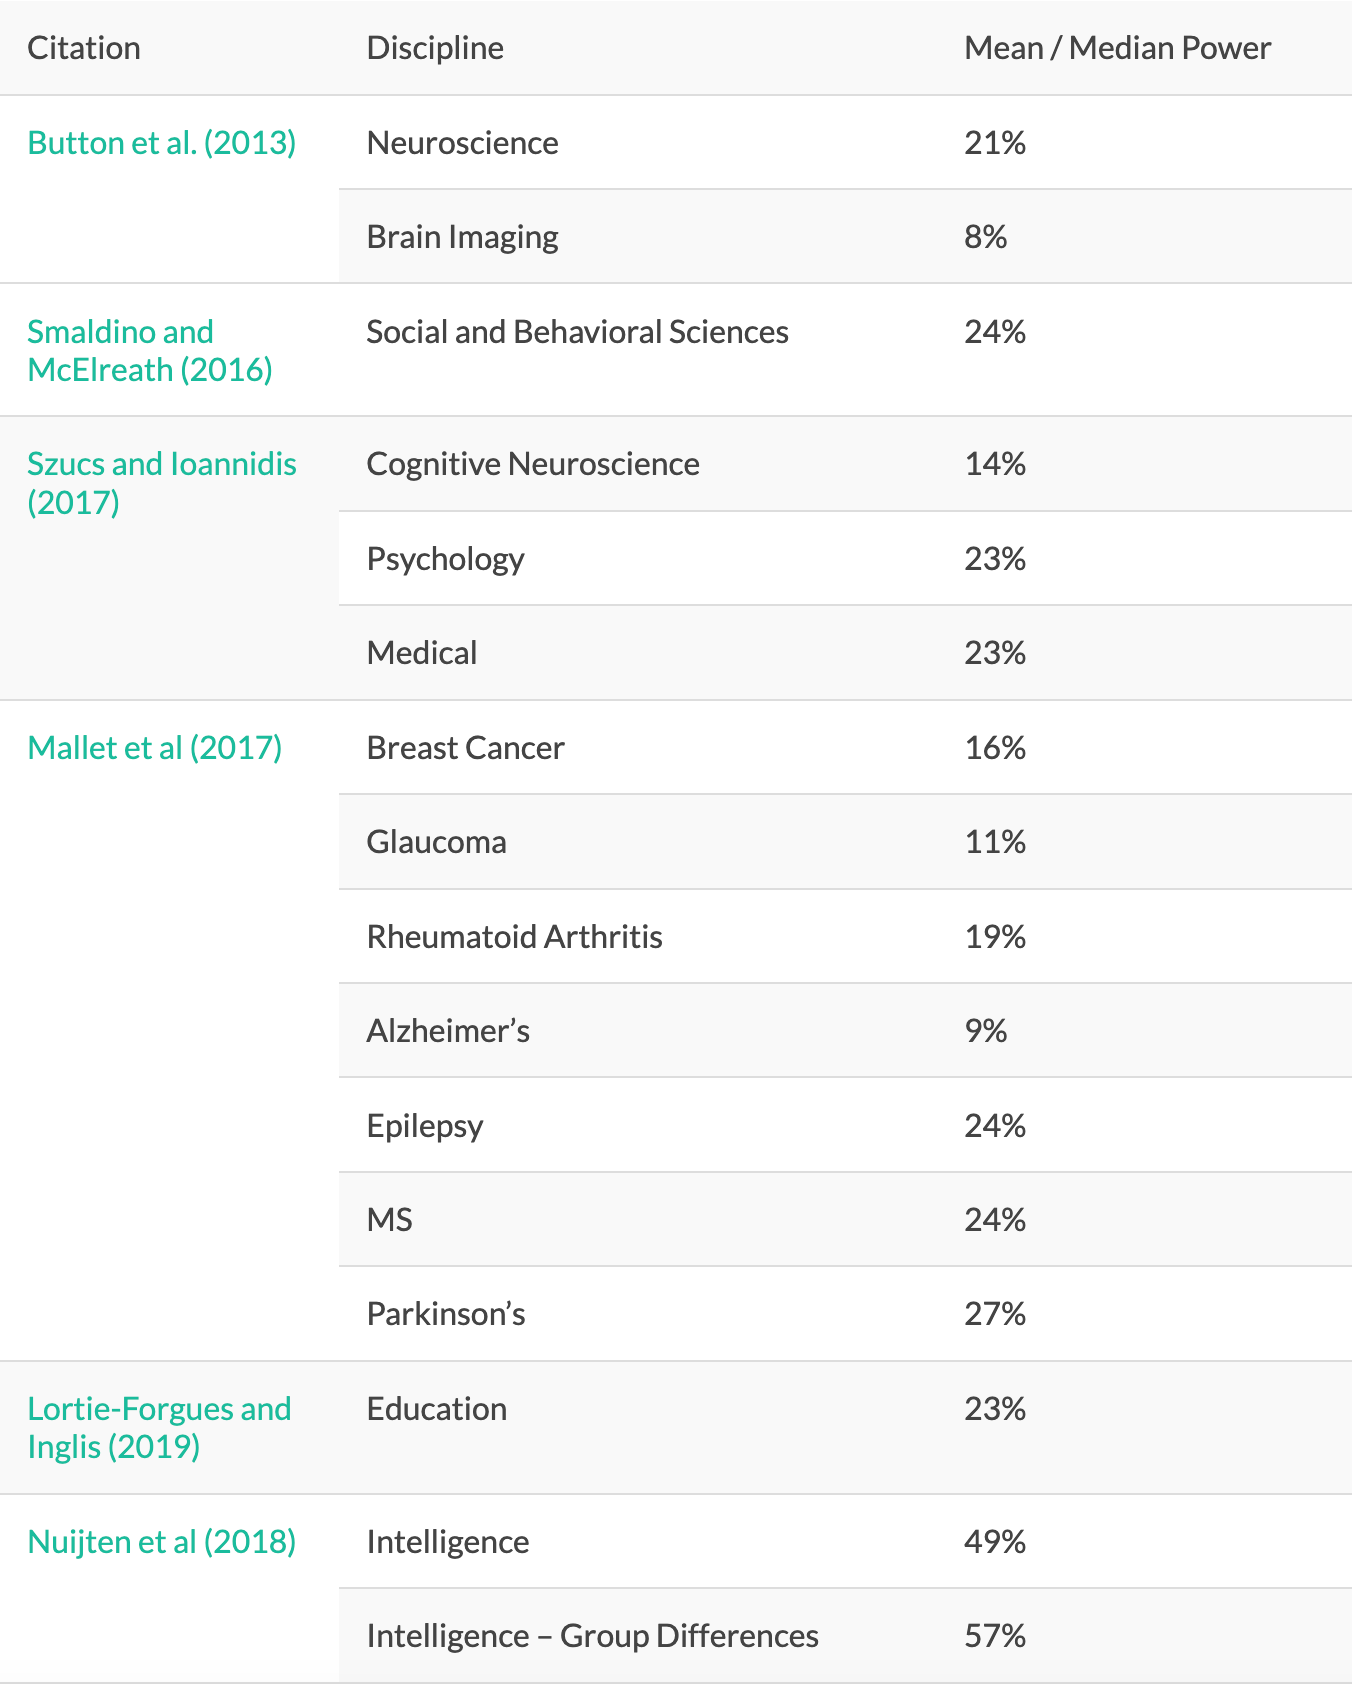
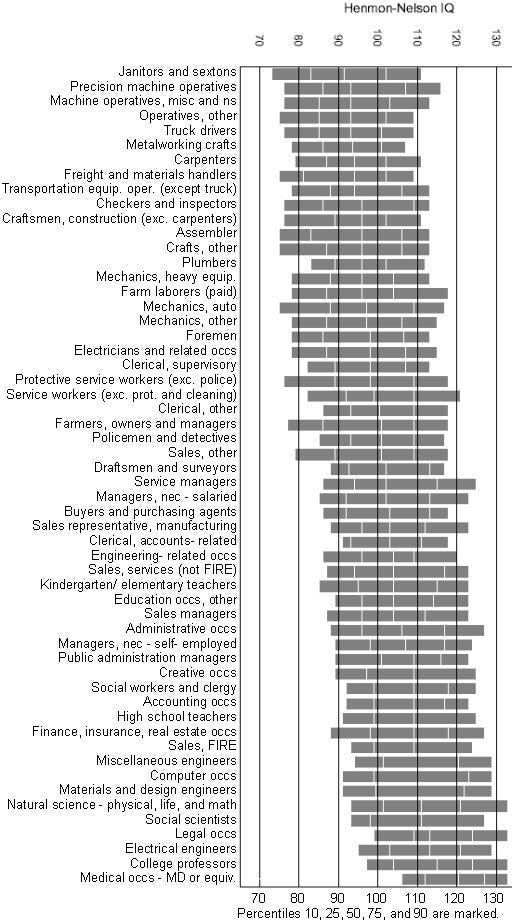
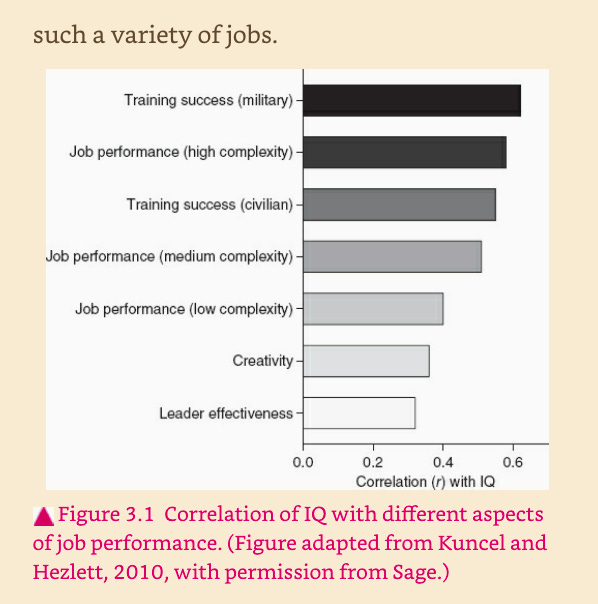
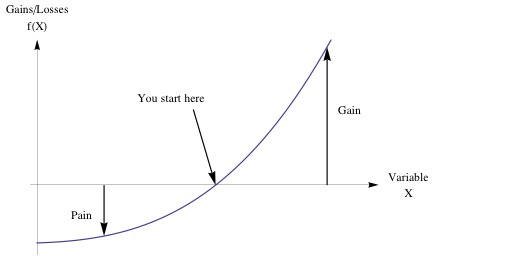
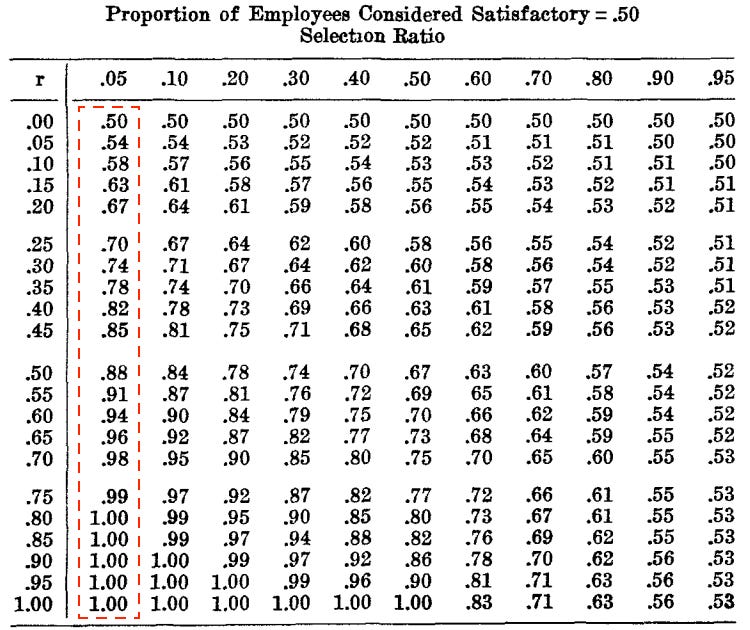