How Smart Are Prisoners?
A bizarre race interaction

It is well established that intelligence correlates negatively with criminality (Ellis et al., 2019, pp. 275-280; Herrnstein & Murray, 1994, ch. 11; Lynn & Vanhanen, 2012, pp. 269-271). However, information regarding the intelligence of prisoners is much sparser than it is in the case of general crime-IQ correlation. In Crime and Human Nature, James Q. Wilson and Richard Herrnstein (1985, ch. 6) reviewed the literature, and found that inmates’ average IQ was about 92. To reach this conclusion, Wilson and Herrnstein had to rely on individual studies, typically with sample sizes of a few hundred people.
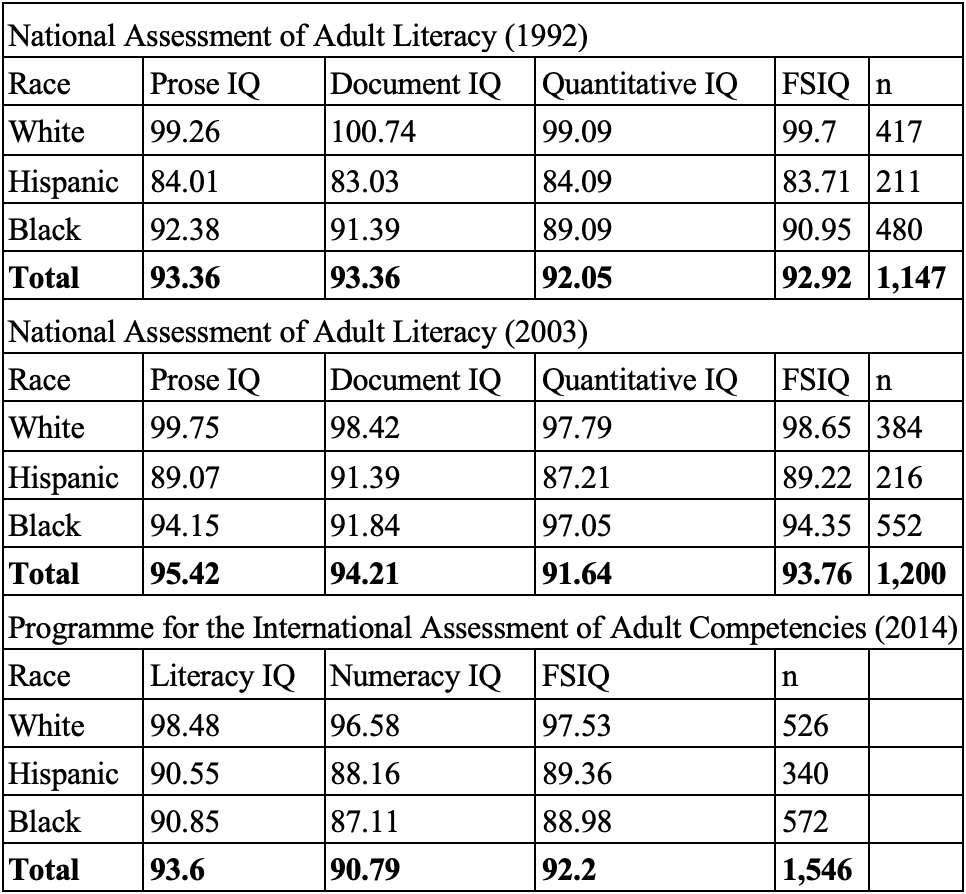
But, today, the IQ of prisoners can be estimated much more precisely using three government surveys: two waves of the National Assessment of Adult Literacy (NAAL) in 1992 and 2003, as well as the 2014 wave of the first cycle of the Programme for the International Assessment of Adult Competencies (PIAAC). Each study involved over 1,000 inmates, for a total sample size of a little under 4,000 prisoners. For each wave, I compared the prisoners to the general, non-incarcerated population. All of this data is not just publicly available, but summarized in easily accessible books published by the U.S. Department of Education (see my data sources below) written for the purpose of comparing prisoners to the general population. However, as far as I know, nobody has ever used this data to calculate IQ scores using the equation 100+15z!1
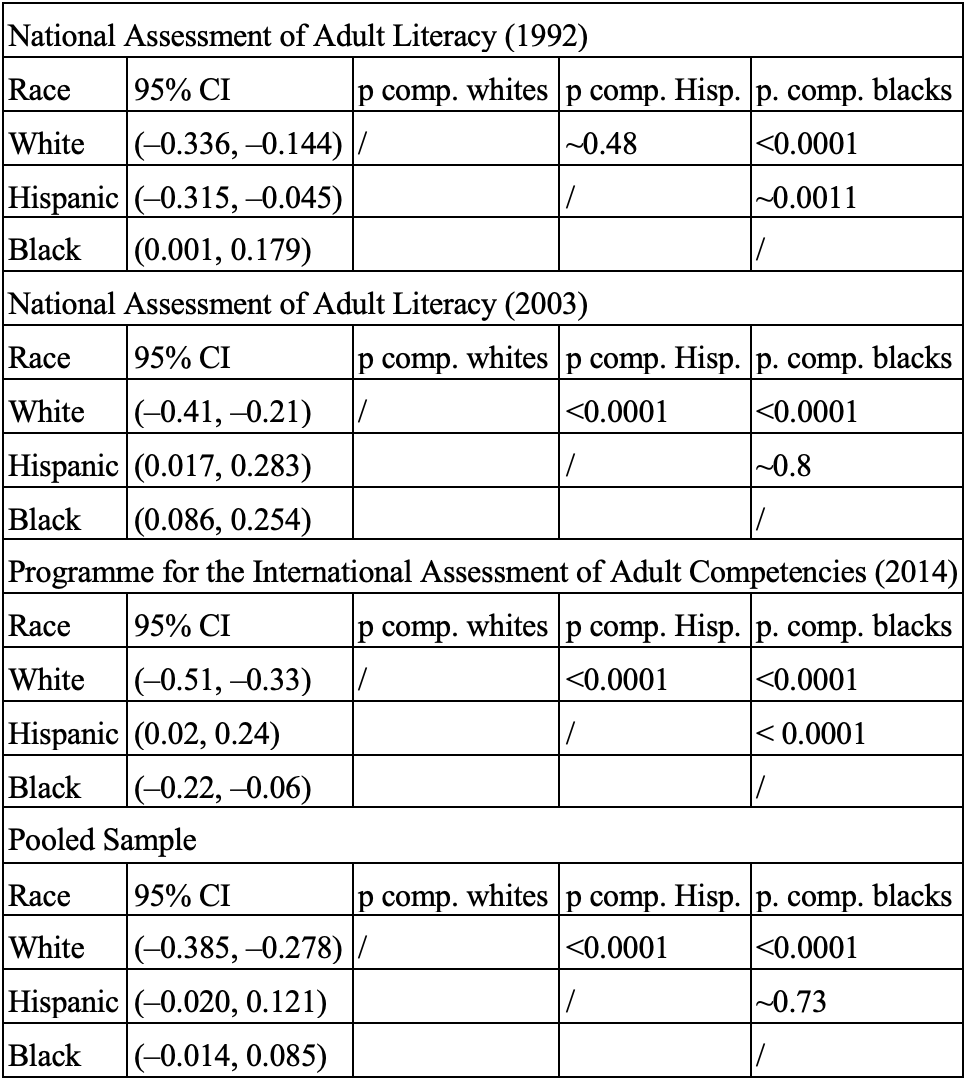
These results are in agreement with an average IQ of about 92—pooling the three samples together, the mean is 92.89. But this is misleading. When the prisoners are compared to the non-incarcerated population of their same race, the IQ difference is very small. In the following table, this is shown using z scores. Among whites, there is a sizable negative correlation in all three databases, ranging from –.24 to –.42, whereas, for the other races, it varies. For blacks, it is negative in the PIAAC and positive in the two NAAL samples. Lastly, for Hispanics, it is positive in the second wave of the NAAL but negative in the other two waves. But, even in those samples where the z score is negative, Hispanic and black inmates differ much less from their general population averages. Pooling the data, and putting it into IQ terms, imprisoned whites are about 5 points dumber (z = –.33), Hispanic prisoners are also duller, but just by one point (z = –.06), and, lastly, incarcerated blacks are half a point brighter (z = .04).
These results are obviously unintuitive, and also do not corroborate Wilson and Herrnstein’s estimate of 92, since most of the studies in that literature review compared white prisoners to whites outside of prison; here, that same procedure gives an IQ of about 95. One solution is that, for nonwhites, there is some kind of horseshoe effect: the dumbest and smartest get incarcerated, which makes the overall effect size close to null. Here is the summary of the evidence I could gather:
In the NAAL 1992, Hispanic and black inmates were not much less likely to be below level 2 (out of five levels) in Literacy or Numeracy than their counterparts outside of prison. As for levels 4 and 5, there was never a significant difference there, either. This is strong evidence against the horseshoe theory.
In the NAAL 2003, blacks and Hispanic prisoners were always much less likely to be below level 2 in any category, with the exception of Hispanics being about equally likely to be below level 2 in the quantitative subtest. However, in all cases, there is no significant difference between household and prison blacks in terms of levels 4 and 5, for any of the subtests. The same can essentially be said for Hispanics, with the caveat that there were instances where the household sample was significantly more likely to be in level 4 or 5 at some subtest. On the whole, it appears that there is little evidence here in favor of the horseshoe hypothesis.
In the PIAAC, the percentage of blacks below level 2 literacy is 36 for those in prison and 33 for those outside of it. This is not evidence for a horseshoe effect. For numeracy, the portion below level 2 is 65% among imprisoned blacks, but 57% among the general black population. This result is mildly supportive of the horseshoe effect. But note, of course, that, in this survey, there actually was a significant negative relationship between prisoner status and IQ among blacks. Among Hispanics, the portion below level 2 in numeracy was slightly higher among inmates, but, when it came to literacy, the incarcerated were actually more likely to achieve level 2 or higher. These results do not support the horseshoe theory.
Lastly, note the extremely low Hispanic IQs. These are verbally focused tests, and, therefore, Hispanics are probably disadvantaged for that reason. If the difference really is due to bias, this creates two problems: 1) the essentially nonexistent correlation between IQ and imprisonment in Hispanics might be an artifact of the test measuring intelligence poorly, and 2) since Hispanics are overrepresented in prisons, this unjustly brings down the IQ of prisoners. The latter definitely does not matter (assuming a more standard IQ of 90 for Hispanics does not significantly change the average IQ of prisoners), while the former might matter, but probably doesn’t, because a null correlation would not be expected even if the test correlates at, say, 0.5 with g.
In the table above, CIs are shown for the individual samples, as well as the pooled data.2 White scores are highly significantly different from black z scores in each sample, as well as the pooled dataset; when compared to Hispanics, the difference is significant in two of the three surveys, as well as in the pooled sample. Lastly, blacks significantly differ from Hispanics in two waves, but not in the NAAL 1992, and not in the pooled data. To summarize, only white-Hispanic and white-black differences are significant in the pooled sample, both with p values under 0.0001.
To be honest, I do not know why imprisoned blacks and Hispanics are not any dumber than those outside prison. The horseshoe hypothesis seems to not have much weight to it, so I am out of ideas. Before someone figures out why this is the case, or someone fails to replicate this finding in a larger study—though I do not think that larger national surveys exist; remember that the pooled sample has an n of about 3,900 prisoners—it is difficult to say how this fact can be applied. For now, I suppose those who trust the data can become rich by betting on smart black people like Neil DeGrasse Tyson going to prison, since these odds are probably greatly underestimated in whatever market exists for that.
Sources Used for Calculations
NCES (1994). Literacy Behind Prison Walls: Profiles of the Prison Population from the National Adult Literacy Survey. U.S. Department of Education.
NCES (2007). Literacy Behind Bars Results From the 2003 National Assessment of Adult Literacy Prison Survey. U.S. Department of Education.
Note: The SDs for both samples and the averages for NAAL 1992 are from NCES (2007), p. 105, fn. 8. Also, sample size by race for NAAL 2003 was estimated by multiplying each group’s proportion of the sample by the size of the total sample. Both these percentages and the size of the sample were rounded in the report, the former to the nearest percentage and the latter probably to the nearest hundred.
NCES (2016). Highlights from the U.S. PIAAC Survey of Incarcerated Adults: Their Skills, Work Experience, Education, and Training. U.S. Department of Education.
Note: The SDs for this sample are from OECD (2019), Appendix 3. Also, sample sizes for each racial group were estimated by multiplying a race’s proportion by the total number of participants. The latter was unrounded, while the former was rounded to the nearest percentage.
References
Ellis, L., Farrington, D., & Hoskin, A. (2019). Handbook of Crime Correlates, Second Edition. Academic Press.
Herrnstein, R. & Murray, C. (1994). The Bell Curve: Intelligence and Class Structures in American Life. The Free Press.
Lynn, R. & Vanhanen, T. (2012). Intelligence: A Unifying Construct for the Social Sciences. Ulster Institute for Social Research.
Wilson, J. & Herrnstein, R. (1985). Crime and Human Nature: The Definitive Study of the Causes of Crime. The Free Press.
For the uninitiated, 100+15z refers to the modern equation for calculating IQ scores (the older one involves mental and chronological ages). In words, it means that a given person’s IQ is 100 more than fifteen times the number of standard deviations they are above the mean on the test they took (if they are below the mean, they are, of course, negative deviations above the mean). Usually, when giving a subject an IQ test, the administrator uses a conversion chart specific to the test, which will tell him what percentile and IQ any raw score corresponds to. However, if one does not have access to the manual, or IQ is not being estimated using a traditional IQ test, it is necessary to rely on this equation.
p values were calculated using the standard z test. The standard deviation used for the necessary calculations was the SD of the whole population tester in the three surveys, because group specific SDs at either the racial or prison-general categories were not given. I believe that pooling the data together is justified because it is all z transformed and comes from very similar tests given to nationally representative samples.


https://vdare.com/articles/how-the-death-penalty-saved-civilization
In this article the authors hypothesize that Caucasian Christian Europe's death penalty from the 1400s to the 1800s got rid of the low IQ , low impulse control, and sociopathic groups. Perhaps in the time since then whites are beginning to "regress to the mean" and the resulting low IQ low impulse control whites end up in prison while the sociopaths end up in Government or the Corporate world.
Blacks and Hispanics didn't have the same culture, so it is the average that ends up in prison.
Not just IQ though.I remember watching a video by Jared Taylor on the topic of psychopathics and I think it was about Eric dutlin's book.How different races have different levels of psychopathic tendencies